AstraZeneca Stock Drops 0.44%, Momentum Weakens In Focus
On Agustus 12, 2026: price 11,844.00 GBp, trend downtrend, RSI 39.5, support 11,500.00, resistance 13,134.00. technical analysis of astrazeneca stock.

AstraZeneca shares on the LSE were last quoted at 11,844.00 GBp, down 0.44% from the previous close, leaving the stock below its short- and medium-term trend lines as traders continue to price in a weaker technical backdrop. The move matters because the shares are now trading under the SMA20 at 12,420.50 and well below the SMA50 at 13,169.08, a configuration that usually signals that recent selling pressure is still outweighing attempts to stabilise. As shown in the chart, the price is sitting in the lower part of its recent range rather than near a breakout point.
Trend & Price Action
The broader structure remains a downtrend, with the SMA20 slope at -3.08% over 5 days pointing lower. In practical terms, that means the short-term average itself is falling, not just the share price, so rallies are being met by a declining reference line rather than a flat one. That often makes recovery attempts harder to sustain.
The stock is also positioned below the SMA20 and far from the SMA50, which tells investors that momentum has not yet shifted back in favour of buyers. There is no new MA-cross, so the chart does not yet show the kind of moving-average reversal that would suggest a cleaner trend change. In simple terms, the short-term trend has not crossed decisively into an uptrend.
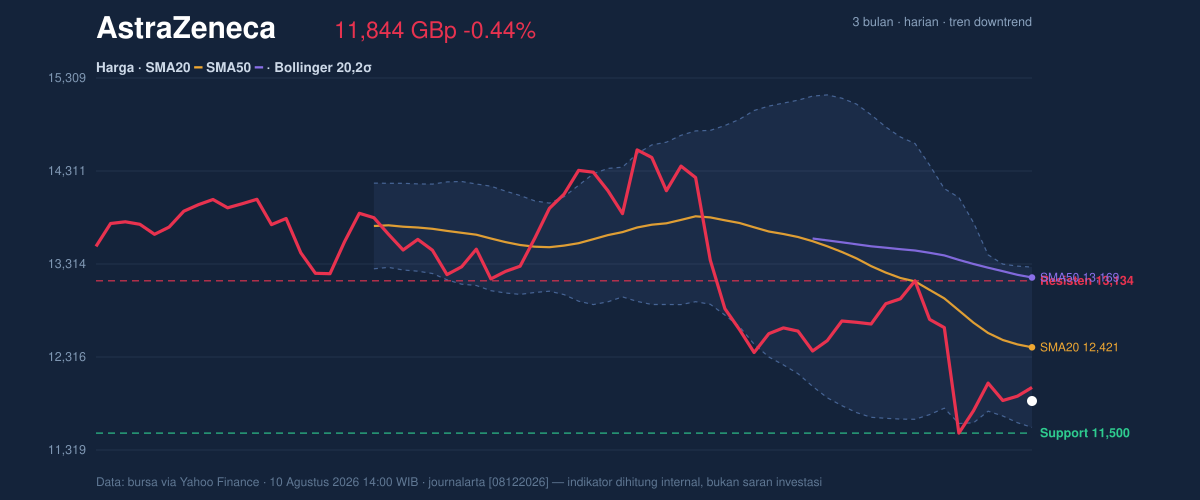
The Bollinger Bands add another layer to that picture. Price is near the lower band, with %B at 16%, which means the shares are trading close to the bottom of the band structure rather than near the middle or upper end. That does not automatically mean an oversold rebound is imminent, but it does show that the market is pricing the stock near the weaker end of its recent distribution. The 13.8% band width is described as normal, so this is not a volatility squeeze that typically precedes a sharp expansion. Instead, the chart suggests a market that is still digesting the prior decline rather than preparing for a major technical reset.
Oscillators & Momentum
The momentum tools are mixed, but not enough to overturn the downtrend. The RSI(14) at 39.5 is neutral, which means the stock is not in classic oversold territory even though it has weakened. That matters because a neutral RSI in a falling trend often indicates the decline has not yet exhausted itself. The share price can still drift lower without triggering the kind of deeply oversold reading that tends to attract stronger countertrend interest.
The stochastic reading is also neutral, with %K at 32.9 and %D at 45.0. That gap shows short-term momentum is softer than the slower signal line, but not yet in a dramatic reversal zone. Put simply, the oscillator is leaning weak without flashing a decisive turning point.
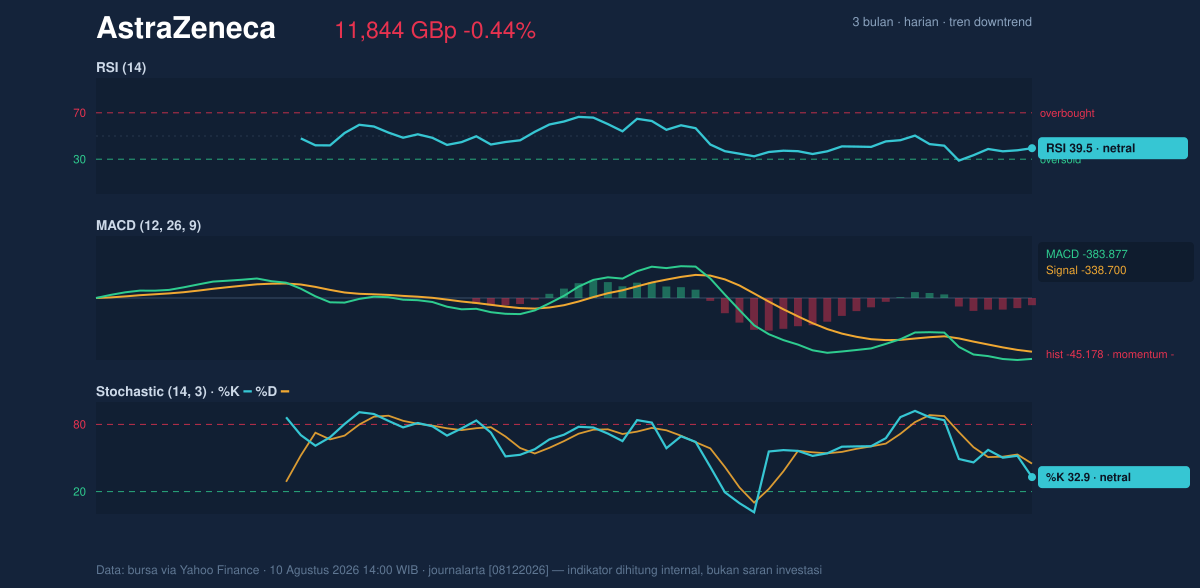
The clearest warning comes from MACD. With MACD at -383.877, below the signal at -338.700, and a histogram of -45.178, momentum remains negative. For non-specialists, MACD compares two trend measures; when the faster line stays below the slower one, it usually means downside momentum still dominates. The negative histogram confirms the gap has not closed, so there is no technical evidence yet that selling pressure has fully faded.
Volatility & Volume
Volatility is present, but not extreme. The ATR(14) at 409.65, or 3.5% of price, suggests the shares can still move meaningfully in a session, but the market is not in panic mode. That is important because a moderate ATR leaves room for both a rebound and another leg lower. It also means that a break of nearby support could travel quickly if participation increases.
Volume offers a subtle counterpoint. Last volume was 3,827,803, below the 20-day average of 4,301,051, or 0.9x normal. Lower turnover during a decline can imply that sellers are not yet forcing a capitulation move, but it can also mean buyers have not stepped in with conviction. The fact that OBV is rising is the key nuance here. OBV, or on-balance volume, tracks whether volume tends to accompany up or down days; a rising OBV while price is weak can suggest underlying accumulation is building quietly beneath the surface. That divergence is not a reversal signal on its own, but it does hint that the selloff may be losing some participation.
Key Levels & Scenarios
The nearest technical reference is support at 11,500.00, with resistance at 13,134.00. The current price is positioned at 21% of the range, which means it is closer to support than resistance and therefore more vulnerable to a break if momentum worsens. The lower Bollinger band at 11,561.03 sits just above support, reinforcing that area as the first zone where buyers may try to defend the chart.
The broader map matters too. The stock’s 3-month high of 15,126.00 and 3-month low of 9,892.00 frame the recent retreat as part of a wider swing rather than a one-day anomaly. As long as price remains below the falling short-term average, rallies are likely to be treated as corrective unless the shares can reclaim the middle band and then the SMA20.
Technical Verdict: HOLD (wait & see)
HOLD (wait & see)
- Price remains below the SMA20 and SMA50, keeping the short- and medium-term trend negative.
- MACD is still negative, so downside momentum has not fully turned.
- OBV is rising, which hints that selling pressure may be easing even though price action has not confirmed a reversal.
Verdict invalidated if price falls below 11,500.00, because that would break the nearest support and expose the lower band area more directly.
- Ideal Entry Range: 11,500.00 to 11,561.03
- Exit Target (Target Price): 12,420.50 to 13,134.00
- Stop Loss protection: below 11,500.00
In plain English: the chart is weak, but it is not weak enough yet to rule out a stabilisation attempt around nearby support.
The latest volume was 3,827,803.
Summary Data AstraZeneca
| Last price | 11,844.00 GBp |
| Change 1 day / 5 days / 1 month | -0.44% / 2.99% / -6.07% |
| Trend / MA-cross | downtrend / none |
| SMA20 / SMA50 | 12,420.50 / 13,169.08 |
| RSI (14) / Stochastic %K | 39.5 / 32.9 |
| Bollinger %B / ATR | 16% / 409.65 |
| Support / Resistance 20 days | 11,500.00 / 13,134.00 |
| Data as of | 10 Agustus 2026 14:00 WIB |


