BP Momentum Weakens: Stock Gains 3.62% (Agustus 12, 2026)
On Agustus 12, 2026: price 535.90 GBp, trend uptrend, RSI 51.1, support 507.70, resistance 555.90. technical analysis of bp stock. BP Momentum Weakens — full…

BP plc is holding above its short-term trend line, but the tape is not yet giving a clean breakout signal. The shares ended at 535.90 GBp, up 3.62% on the day, yet the move sits inside a broader pattern that still needs confirmation from volume and momentum.
Trend & Price Action
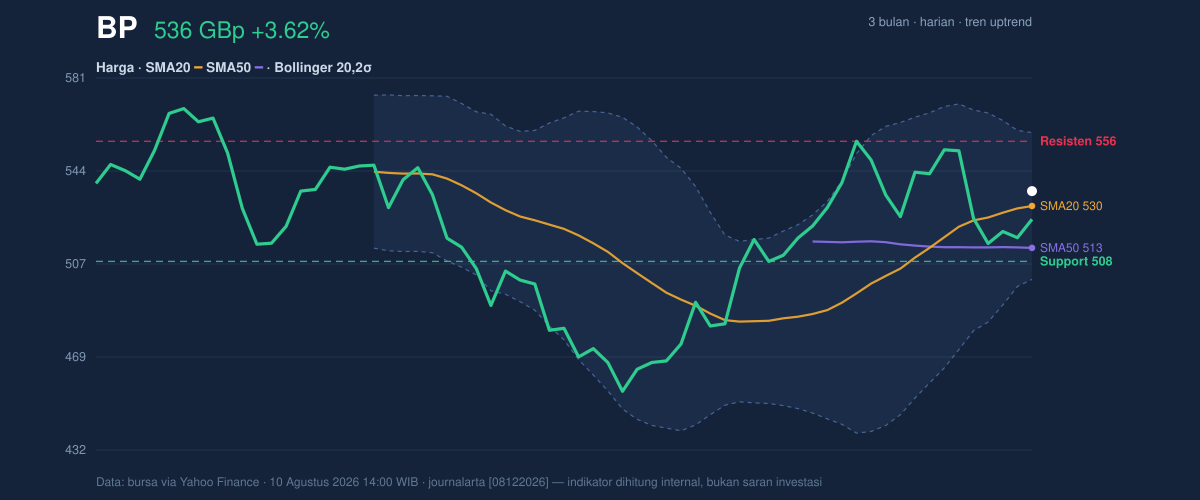
As shown in the chart, BP is trading above the SMA20 at 529.94 and also above the SMA50 at 513.11, which keeps the medium-term structure constructive. The uptrend label is supported by the SMA20 slope of 1.59% over 5 days; that matters because a rising short-term average usually means buyers have been willing to pay progressively higher prices rather than just reacting to one headline.
Still, the move is not a breakout in the classic sense. There is no fresh MA-cross, so the chart is not showing a new moving-average confirmation event. In plain English, the faster trend line has not delivered a new signal that would typically mark a stronger shift in market control.
The stock is also sitting 59% of the way through its 20-hour range between 507.70 support and 555.90 resistance. That positioning is important: it says BP is not at the bottom where bargain-hunting usually dominates, but neither is it pressing the upper boundary hard enough to suggest a decisive breakout attempt. The broader 3-month range, from 450.60 to 575.70, shows there is still plenty of room for the share price to move in either direction if fresh catalysts appear.
Oscillators & Momentum
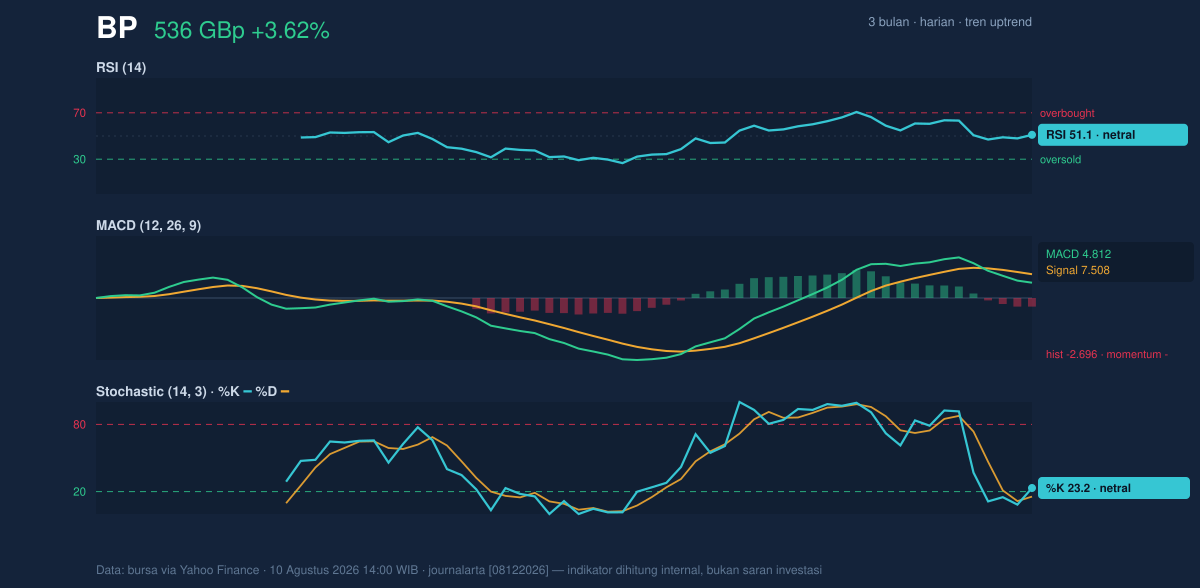
The momentum picture is mixed, and that is the main reason the chart feels less convincing than the trend alone would suggest. RSI at 51.1 is neutral, which means the stock is neither stretched upward nor washed out. That is usually a sign of balance rather than urgency.
The Stochastic at 23.2 / 15.5 is also neutral, though it sits closer to the lower end of its range. That often implies the stock has cooled after a recent lift, but without a strong reversal signature. In practical terms, it suggests BP has room to recover further if buyers return, but the oscillator is not flashing a strong “go” signal on its own.
The more telling indicator is MACD. MACD at 4.812 remains below the signal line at 7.508, and the histogram at -2.696 is negative. That combination usually means the recent price advance has not yet translated into broad momentum strength. Put simply, price is holding up better than momentum, which can happen early in a recovery or when a rally is running out of steam. The chart, as shown, is therefore more “improving but unconfirmed” than “fully aligned.”
Volatility & Volume
Bollinger Bands help frame whether the move is becoming stretched. BP’s %B at 60% places the price in the upper half of the band structure, but not near the top edge. With the upper band at 559.37 and the lower band at 500.50, the stock is still trading in a normal volatility envelope rather than a compressed squeeze or an extreme expansion phase. The 11.1% band width is also described as normal, which matters because it suggests the market is not yet pricing a dramatic near-term move.
ATR adds another layer. ATR(14) at 16.63, equal to 3.1% of price, points to moderate volatility. That means daily swings are large enough to matter, but not so wild that the chart is in disorder.
The caution flag is volume. Last trade activity was 21,522,465, well below the 20-day average of 45,566,890, or roughly 0.5x. In market terms, that is a quiet session, and quiet rallies are often less durable because they lack broad participation. The falling OBV reinforces that concern: on-balance volume is a way of tracking whether money flow is accumulating or leaking away, and a decline says participation has not yet fully backed the price recovery.
Key Levels & Scenarios
The chart’s most immediate battleground is the 555.90 resistance. A sustained move through that area would tell the market is willing to test the upper part of the recent range and potentially revisit the 575.70 3-month high. On the downside, 507.70 support is the key line to watch; if that fails, the price would likely be signaling that the latest bounce has lost traction.
The Bollinger middle line at 529.94 also matters as a pivot. Because BP is currently above it, that level acts like a short-term “line of balance.” If the shares slip back under it, the chart would look less like a rising trend and more like a range-bound recovery attempt. If they hold above it while volume improves, the technical case strengthens.
Technical Verdict: HOLD (wait & see)
Strongest reasons:
- Price is above SMA20 and SMA50, which keeps the trend constructive.
- RSI is neutral and Stochastic is not overextended, so the move is not obviously exhausted.
- MACD is still below the signal line and the histogram is negative, so momentum has not confirmed the price strength.
- Volume is only 0.5x average and OBV is falling, which weakens the quality of the advance.
Verdict invalidated if price falls below 507.70 support.
- Ideal entry range: 529.94 to 507.70
- Exit target: 555.90, with 575.70 as the next chart reference if resistance gives way
- Stop loss protection: below 500.50, the lower Bollinger band
In plain English: BP is in a decent technical position, but the market has not yet shown enough momentum and participation to call the move fully confirmed.
The next scheduled test is whether the shares can close decisively through 555.90 resistance while volume returns toward the 45,566,890 average.
Summary Data BP
| Last price | 535.90 GBp |
| Change 1 day / 5 days / 1 month | 3.62% / -2.93% / 6.12% |
| Trend / MA-cross | uptrend / none |
| SMA20 / SMA50 | 529.94 / 513.11 |
| RSI (14) / Stochastic %K | 51.1 / 23.2 |
| Bollinger %B / ATR | 60% / 16.63 |
| Support / Resistance 20 days | 507.70 / 555.90 |
| Data as of | 10 Agustus 2026 14:00 WIB |


