DBS Stock Analysis: Gains 2.54%, RSI Overbought
On Agustus 12, 2026: price 76.99 SGD, trend uptrend, RSI 73.5, support 70.79, resistance 76.33. technical analysis of dbs stock. DBS Stock Analysis — full…

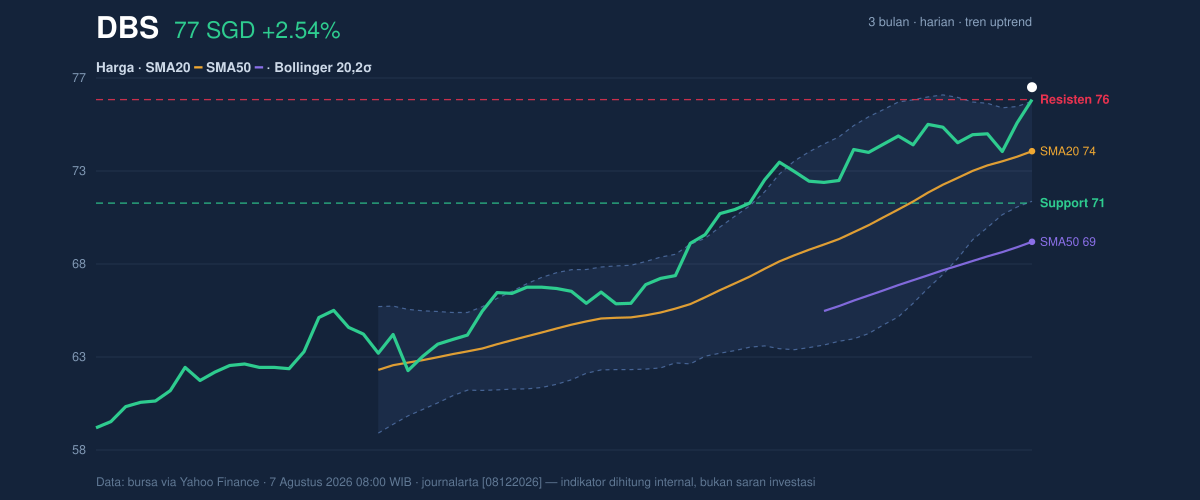
DBS Group’s shares closed at SGD 76.99, up 2.54% in the latest session, and the move matters because it pushed the stock above the upper Bollinger band and to a fresh challenge of its 3-month high at SGD 76.33. That is the kind of price action that usually signals strong demand, but in this case the technical picture is more nuanced: the trend is still pointing higher, yet momentum gauges are flashing stretched conditions, which often means the market is energetic but increasingly vulnerable to a pause.
Trend & Price Action
The bigger structure remains constructive. DBS is trading above its SMA20 at SGD 73.57 and well above its SMA50 at SGD 68.72, which tells readers that the stock is not just bouncing — it is holding a higher base than it did over the medium term. The uptrend is still intact, with the SMA20 slope up 1.98% over 5 days, a sign that the short-term average is rising rather than flattening. That rising slope is important: it means recent prices have been strong enough to pull the trend line higher, not merely drift sideways.
But the chart also shows the stock is no longer in a comfortable middle zone. At 112% of its 20-hour range, DBS is trading beyond the top of the recent band, which often happens when buyers push a move to an extreme. The 20-hour resistance at SGD 76.33 has already been exceeded by the latest price, so the market is now asking whether that breakout is genuine or simply an overextension.
A short line can say a lot here: the trend is up, but the stock is now leaning hard against resistance.
Oscillators & Momentum
The momentum tools are less flattering than the price chart. The RSI at 73.5 is in overbought territory, meaning the recent climb has been fast enough that the stock may be ahead of itself in the short run. The Stochastic %K at 100.0 and %D at 81.3 reinforce that message: the price is pressing the upper end of its recent trading range, and the oscillator is showing that the move has become crowded. In plain language, buyers have been dominant, but the market may be running low on fresh fuel.
The more subtle warning comes from MACD. The MACD at 1.906 is still positive in absolute terms, which usually reflects an underlying uptrend, but it sits below the signal line at 2.021 and the histogram at -0.115 is negative. That combination means the trend has not broken, but its pace is slowing. In technical terms, price is strong while momentum is fading — a classic divergence that often precedes consolidation rather than immediate continuation.
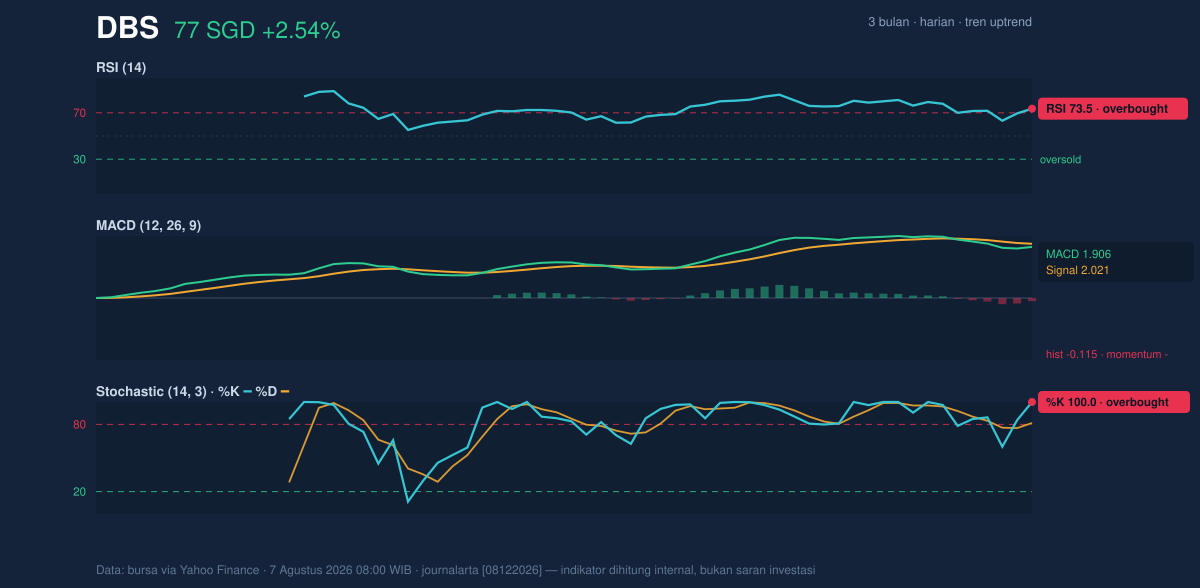
That is the key tension in the chart: price is pushing highs, while momentum is no longer confirming with the same force.
Volatility & Volume
Bollinger positioning adds to the same story. DBS is trading above the upper band at SGD 76.24, with %B at 114%, which means price is not merely near the top of the band but outside it. That is usually a sign of unusually strong upside pressure, but it also raises the probability of mean reversion — the tendency for price to drift back toward the average after a sharp move. The band width of 7.3% is described as a squeeze, which matters because compressed bands often precede a larger move. In this case, the market has already chosen direction to the upside, but the squeeze suggests the next move could still be sizeable — just not necessarily straight up.
Volume confirms participation rather than exhaustion. The latest volume of 6,786,400 was about 1.4× the 20-hour average of 4,817,997, and OBV is rising. That matters because a price breakout with heavier-than-normal trading and rising on-balance volume is more credible than one made on thin activity. In other words, this is not a lonely spike; more market participants appear to be involved.
At the same time, ATR(14) at 1.20, or 1.6% of price, indicates moderate volatility. So while the stock is stretched, the daily swing environment is not extreme. That leaves room for a controlled pullback or sideways digestion rather than a disorderly reversal.
Key Levels & Scenarios
The most important reference points are clear. The immediate support sits at SGD 70.79, while the nearest resistance is the already-tested SGD 76.33. The stock is now above both its SMA20 at SGD 73.57 and its upper Bollinger band at SGD 76.24, which means the chart is stretched but still technically bullish as long as price holds above the short-term average.
If DBS can remain above SGD 76.33, the market would be confirming that the latest push is not just an overshoot but a sustained breakout. If it fails to hold above that level, the first area to watch is the SMA20 at SGD 73.57, where trend-followers often reassess. A deeper fade toward SGD 70.79 would suggest the breakout has lost traction and the market is reverting to its recent range.
The signal is strong, but it is not clean.
Technical Verdict: HOLD (wait & see)
HOLD (wait & see) fits the chart because the trend is positive, but the momentum stack is overextended and starting to diverge.
Strongest reasons:
- Price above SMA20 and SMA50, with the SMA20 slope still rising, keeps the trend structure bullish.
- RSI at 73.5 and Stochastic %K at 100.0 show the move is overbought, which raises pullback risk.
- MACD histogram at -0.115 is negative, meaning momentum is cooling even as price stays high; volume at 1.4× normal and rising OBV still support participation.
Verdict invalidated if price breaks below SGD 70.79, because that would damage the nearest support structure and weaken the current uptrend.
- Ideal Entry Range: SGD 73.57 to SGD 76.33
- Exit Target (Target Price): SGD 76.33 initially, then a sustained hold above the upper Bollinger band at SGD 76.24
- Stop Loss protection: SGD 70.79
For non-traders: DBS is still in an uptrend, but the stock has run hot enough that it may need to cool off before the next move becomes clearer.
“This is a breakout that still needs proof, not just applause.”
Summary Data DBS
| Last price | 76.99 SGD |
| Change 1 day / 5 days / 1 month | 2.54% / 4.01% / 9.28% |
| Trend / MA-cross | uptrend / none |
| SMA20 / SMA50 | 73.57 / 68.72 |
| RSI (14) / Stochastic %K | 73.5 / 100.0 |
| Bollinger %B / ATR | 114% / 1.20 |
| Support / Resistance 20 days | 70.79 / 76.33 |
| Data as of | 7 Agustus 2026 08:00 WIB |


