Golden Cross Formed, AIA Stock Drops 1.75% Today
On Agustus 12, 2026: price 72.85 HKD, trend sideways, RSI 42.7, support 73.15, resistance 79.65. technical analysis of aia stock. Golden Cross Formed — full…

AIA Group fell to 72.85 HKD in Hong Kong trade on 10 August 2026, slipping 1.75% from the previous close of 74.15 as the stock moved back below its short-term trend markers. The drop leaves the insurer trading under its SMA20 at 76.87 and SMA50 at 75.41, even though the chart still shows a golden cross — the point where the 20-day average has crossed above the 50-day average. That combination matters because it says the longer setup has improved, but the market is not yet rewarding it with sustained buying. Price is now sitting close to the lower end of its recent band, and the message from the tape is that momentum has cooled faster than the moving averages have caught up.
Trend & Price Action
As shown in the chart, AIA is still in a sideways trend, with the SMA20 slope at 0.92% over 5 days suggesting the short-term trend has not rolled over into a clear downtrend. But the more immediate signal is weaker: the shares are trading below the SMA20 and SMA50, which often means the market is struggling to hold gains after a rebound. That is reinforced by the stock’s position in the recent range. The 20-hour support at 73.15 is now just above the last price, while 20-hour resistance at 79.65 remains well overhead. In practical terms, AIA is near the bottom of that band, with little evidence yet that buyers are willing to step in aggressively.
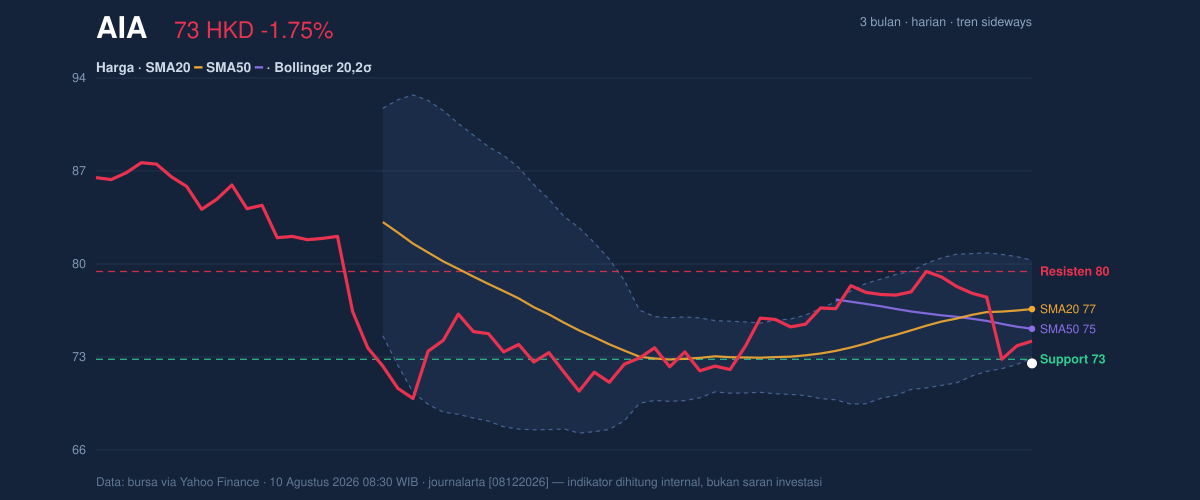
The broader 3-month range adds context. The stock has traded between 89.00 and 69.05, and the current price is much nearer the lower end than the upper end. That does not automatically signal breakdown, but it does show that the recent recovery attempt has lost traction. The fact that the price is still above the 3-month low keeps the structure intact, yet the failure to reclaim the moving averages suggests the market is treating rallies as opportunities to fade rather than to extend.
Oscillators & Momentum
The momentum picture is mixed, but the balance still tilts negative. RSI at 42.7 is neutral, which means the stock is neither stretched on the upside nor deeply oversold. That is important because neutral RSI after a decline often signals hesitation rather than conviction. The Stochastic %K at 40.8 and %D at 34.9 are also neutral, showing price is not yet in a classic rebound zone, but it is no longer deeply weak either. In plain language, the stock has cooled, but it has not yet shown the kind of momentum turn that usually marks a durable lift.
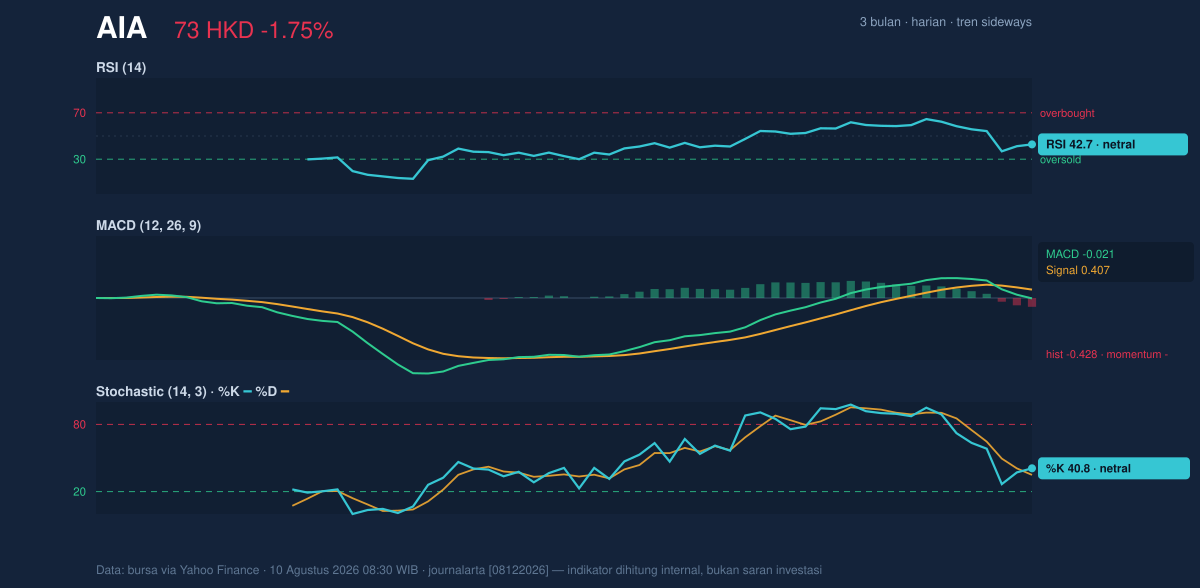
The sharper message comes from MACD at -0.021, with the signal line at 0.407 and the histogram at -0.428. MACD is a trend-following momentum gauge, and a negative histogram means downside force is still dominating the short-term move. That matters more than the neutral oscillators because it suggests the recent slide is not just noise. The stock may be sideways on the broader frame, but momentum is still leaning against the bulls. For readers unfamiliar with the term, a negative MACD histogram means the stock’s recent price action is tracking below the pace needed to confirm an upswing.
Volatility & Volume
Volatility is present, but not extreme. The ATR(14) at 2.12, equal to 2.9% of price, points to moderate daily movement rather than a disorderly swing. That matters because it suggests the current decline is happening in a market that can still move decisively without being chaotic. The Bollinger Band width of 9.4% is described as normal, which means there is no compression signal hinting at an imminent explosive move. Price is also sitting below the middle band at 76.87 and near the lower band at 73.25, while %B at -6% indicates the stock is pressing against the lower edge of its recent volatility envelope. In simple terms, the chart is leaning weak, but not yet showing the kind of panic that would usually accompany a capitulation low.
Volume, however, is more interesting. Last trading volume of 40,471,051 was about 1.5× the 20-day average of 26,916,633, which means the decline was backed by stronger participation than usual. That often signals conviction, not indifference. At the same time, OBV is falling, and that is a caution flag: on-balance volume tracks whether volume is accumulating into strength or leaving the stock during weakness. A falling OBV tells us the heavier trading has not yet translated into sustained accumulation. So while the market is active, the activity is still accompanying distribution rather than a clean reversal.
Key Levels & Scenarios
The nearest line in the sand is 73.15 support. If that level gives way, the chart would likely shift from weak consolidation toward a deeper retracement, especially because price is already below both key moving averages. On the upside, 75.41 and 76.87 are the first technical hurdles, with 79.65 resistance the more meaningful ceiling because it marks the top of the recent trading range. A move back above the middle Bollinger band at 76.87 would help repair the short-term structure, but only a push through 79.65 would show that buyers have regained control of the range.
The current setup is best read as a market trying to defend a fragile base while momentum remains soft. The golden cross keeps the medium-term structure from turning outright bearish, but the price sitting below both moving averages, the negative MACD histogram, and the falling OBV all say the burden of proof is still on the bulls.
Technical Verdict: HOLD (wait & see)
HOLD (wait & see)
- RSI at 42.7 and Stochastic %K/%D at 40.8/34.9 are neutral, so momentum is not strong enough to confirm a rebound.
- MACD at -0.021 with a -0.428 histogram keeps the short-term signal negative.
- Price below SMA20 76.87 and SMA50 75.41, despite the golden cross, shows the bullish crossover has not yet been validated by price.
- Verdict invalidated if price breaks below 73.15, the 20-hour support.
- Ideal entry range: 73.15 to 75.41
- Exit target: 76.87, with 79.65 as the next resistance-based target zone
- Stop loss protection: below 73.15, or more conservatively below 73.25 near the lower Bollinger band
In plain English, the chart says AIA is not broken, but it still has to prove that recent selling pressure has finished.
Summary Data AIA
| Last price | 72.85 HKD |
| Change 1 day / 5 days / 1 month | -1.75% / -7.26% / 0.62% |
| Trend / MA-cross | sideways / golden |
| SMA20 / SMA50 | 76.87 / 75.41 |
| RSI (14) / Stochastic %K | 42.7 / 40.8 |
| Bollinger %B / ATR | -6% / 2.12 |
| Support / Resistance 20 days | 73.15 / 79.65 |
| Data as of | 10 Agustus 2026 08:30 WIB |


