HSBC Stock Drops 0.33%, Momentum Weakens In Focus
On Agustus 12, 2026: price 1,524.20 GBp, trend sideways, RSI 53.1, support 1,479.80, resistance 1,597.40. technical analysis of hsbc stock.

HSBC Holdings’ shares on the London Stock Exchange slipped to 1,524.20 GBp on 10 August 2026, down 0.33% on the day and 4.58% over five days, even as the stock still sits 4.25% higher over one month. That mix matters: the short-term tone has softened, but the broader monthly trend has not broken down. As shown in the chart, the price is now trading below the 20-day average at 1,532.33, which tells traders the latest pullback has enough force to keep HSBC pinned under its near-term trend line for now.
Trend & Price Action
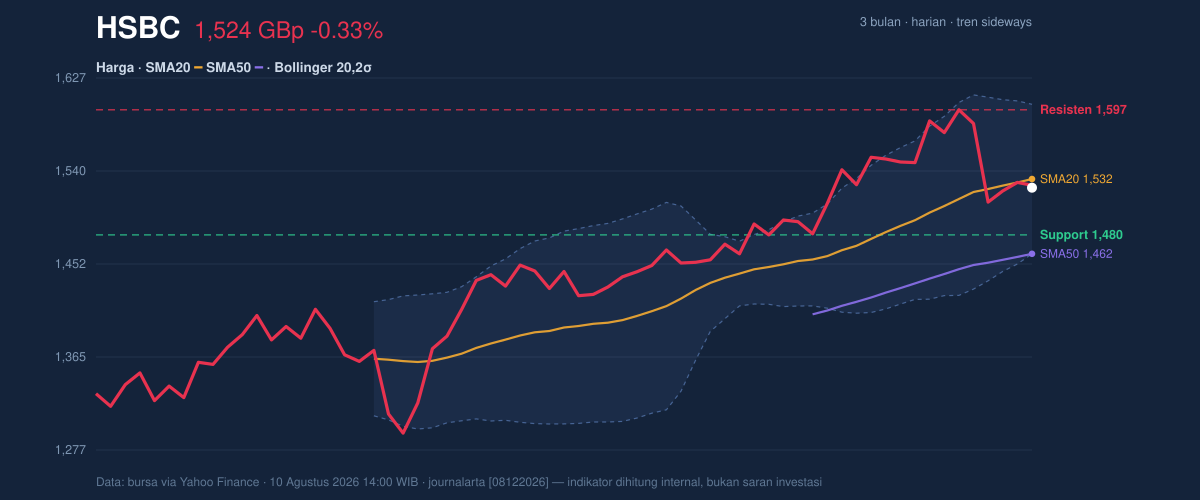
The chart shows a market that is sideways, not trending cleanly in either direction, with the SMA20 still rising at a measured 1.24% over five days. That detail is important: a rising short-term average suggests the recent dip is more of a test of momentum than a full trend reversal. At the same time, HSBC remains well above its SMA50 of 1,462.00, so the medium-term structure is still constructive. The absence of a fresh MA-cross means there is no new moving-average signal to confirm a stronger directional shift.
The stock is also positioned at about 38% of its 20-hour range, which places it in the lower half of the recent band but not at a breakdown point. In plain terms, the market is leaning cautious, not panicked.
The key message is simple: HSBC is correcting inside a broader base, not collapsing out of it.
Oscillators & Momentum
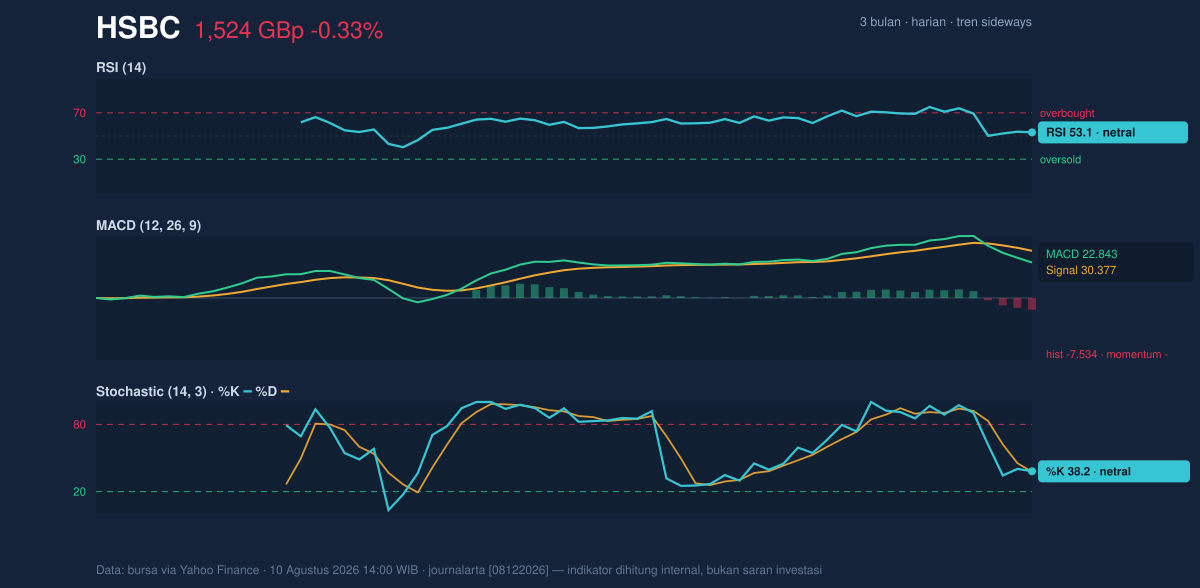
Momentum readings are mixed, and that is the heart of the current setup. The RSI at 53.1 is neutral, which means the stock is neither stretched nor oversold. The Stochastic %K at 38.2 and %D at 37.6 are also neutral, showing no strong overbought or oversold condition. In other words, the oscillator panel is not warning of an immediate exhaustion move.
The more important signal comes from MACD: the line at 22.843 sits below the signal line at 30.377, while the histogram is -7.534. That negative spread means downside momentum is currently stronger than upside momentum, even if the broader trend has not turned bearish. For readers unfamiliar with the indicator, MACD is a trend-following gauge; when it sits below its signal line, it usually means the latest price impulse has lost strength.
So the technical picture is not bearish in the classic sense, but it is momentum-negative.
Volatility & Volume
The Bollinger Bands help explain why the stock may be drifting rather than breaking sharply. The price sits below the middle band at 1,532.33, with the upper band at 1,602.62 and the lower band at 1,462.04. The %B reading of 44% shows HSBC is below the midpoint of the band structure, reinforcing the idea that sellers have the edge in the near term without forcing the stock into an extreme zone. The band width of 9.2% is normal, not compressed, so there is no strong “squeeze” signal pointing to an imminent volatility burst.
ATR adds another layer. At 37.16, or 2.4% of price, volatility is moderate. That means the market has enough room to move, but not enough tension to suggest a disorderly swing unless a support or resistance level gives way.
Volume is the one area where the move lacks conviction. Last volume was 12,744,378, roughly 0.5x the 20-day average of 26,697,770. Thin participation often weakens the reliability of a one-day drop, because fewer shares are changing hands. Yet OBV, or on-balance volume, is rising, which signals that longer-term accumulation has not disappeared. That combination — light current volume but rising OBV — suggests the market is not broadly abandoning the stock.
Key Levels & Scenarios
The nearest support from the 20-hour range is 1,479.80, while resistance stands at 1,597.40. Those levels frame the immediate battle. If HSBC can reclaim the 1,532.33 SMA20, the chart would improve because the price would move back above the short-term trend marker and closer to the middle of the Bollinger structure. If it fails to hold 1,479.80, the market would be signaling that the current pullback is no longer just a pause.
The broader 3-month range also matters. HSBC’s high is 1,610.00 and its low is 1,267.20, so the shares are still trading in the upper half of that wider range. That is a sign of underlying resilience, even if the near-term tape has turned choppy.
HSBC is trading in a controlled pullback, with medium-term structure intact but short-term momentum still soft.
Technical Verdict: HOLD (wait & see)
HOLD (wait & see)
- MACD is negative because the line is below the signal line and the histogram is below zero, which argues against assuming the recent weakness has finished.
- Price is below the SMA20, so the stock has not yet reclaimed its short-term trend.
- OBV is rising and the price remains above the SMA50, which keeps the broader structure from turning outright bearish.
Verdict invalidated if price falls below 1,479.80.
- Ideal Entry Range: 1,479.80 to 1,532.33
- Exit Target (Target Price): 1,597.40
- Stop Loss protection: below 1,462.04
In plain English: the chart says HSBC is still holding its broader shape, but the next move needs confirmation before the short-term tone improves.
The latest 20-hour support level remains 1,479.80.
Summary Data HSBC
| Last price | 1,524.20 GBp |
| Change 1 day / 5 days / 1 month | -0.33% / -4.58% / 4.25% |
| Trend / MA-cross | sideways / none |
| SMA20 / SMA50 | 1,532.33 / 1,462.00 |
| RSI (14) / Stochastic %K | 53.1 / 38.2 |
| Bollinger %B / ATR | 44% / 37.16 |
| Support / Resistance 20 days | 1,479.80 / 1,597.40 |
| Data as of | 10 Agustus 2026 14:00 WIB |

