HSBC Stock Gains 0.31%, Momentum Weakens In Focus
On Agustus 12, 2026: price 161.70 HKD, trend uptrend, RSI 58.6, support 152.60, resistance 168.20. technical analysis of hsbc stock. HSBC Stock Gains — full…

HSBC Holdings ended at 161.70 HKD on HKEX, up 0.31% from the previous close, but the tape is sending a more nuanced message than the headline gain suggests. The shares remain in an uptrend and are trading above the SMA20 at 161.03 and well above the SMA50 at 152.77, yet momentum has begun to soften: the MACD is below its signal line and volume is running at only 0.5× the 20-day average, with OBV falling. In plain terms, HSBC is still structurally firm, but the latest leg higher is not being backed by strong participation.
Trend & Price Action
As shown in the chart, the stock is sitting in the upper half of its recent range, at about 58% of the way from support to resistance, which means buyers have kept control, but not aggressively enough to force a breakout. The SMA20 is rising by 1.50% over 5 days, a constructive sign that short-term trend direction remains positive. The absence of a fresh MA-cross matters too: there is no new moving-average crossover to suggest a sudden regime shift, so the current move looks more like continuation than acceleration.
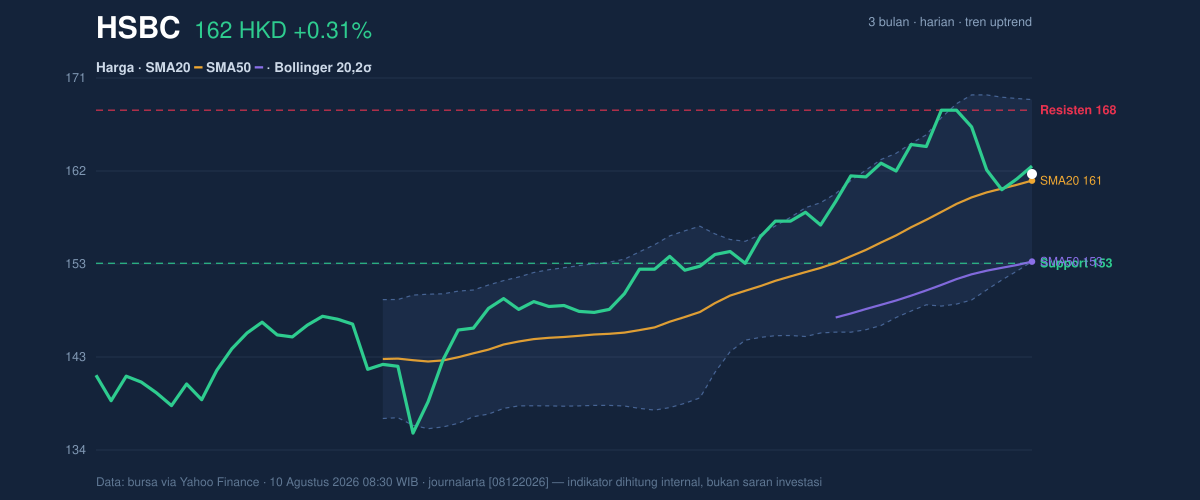
The broader structure also fits that reading. HSBC is only a fraction below the 20-day resistance at 168.20, while the lower boundary sits at 152.60. That leaves the stock inside a relatively contained band rather than in open price discovery. The 3-month high of 169.70 sits just above the current resistance zone, which tells readers the market has already tested this area recently and failed to extend decisively. When a stock trades close to a recent high but cannot expand on volume, it often signals hesitation rather than conviction.
Oscillators & Momentum
The momentum picture is mixed, and that is the key story. The RSI at 58.6 is neutral, meaning the shares are neither stretched nor washed out. The Stochastic %K at 41.9 and %D at 38.2 are also neutral, but with the faster line only modestly above the signal line, which points to stabilization rather than a strong upside impulse. In other words, the oscillators are not warning of an immediate reversal, but they are also not confirming a forceful breakout.
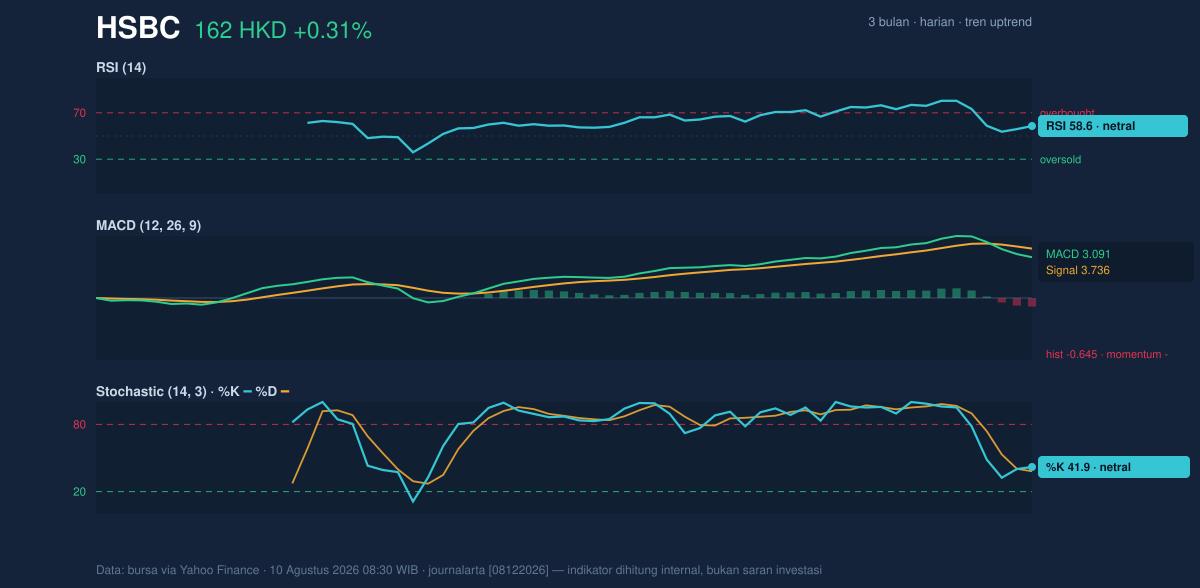
The more important caution comes from the MACD at 3.091 sitting below the signal at 3.736, with a histogram of -0.645. That combination means short-term momentum has slipped under its own average, a classic sign that upward pressure is fading even while price remains above trend support. For general readers, MACD is a trend-following gauge: when it turns negative relative to the signal line, it often means the market is losing pace before price itself shows obvious weakness. Here, the divergence is not severe, but it is enough to keep the chart from looking fully synchronized.
Volatility & Volume
Volatility is moderate, not explosive. The ATR(14) at 3.19 equals about 2.0% of price, suggesting a typical daily swing that is large enough to matter but not large enough to imply disorder. Bollinger Bands reinforce that sense of balance: price is near the middle band at 161.03, with the upper band at 169.28 and lower band at 152.78. The %B at 54% says the shares are slightly above the midpoint of the band structure, while the 10.2% band width indicates normal—not compressed, not expanded—volatility. That matters because a squeeze would hint at an imminent sharp move; this setup does not.
Volume, however, is the quiet warning. Last turnover of 8,270,003 shares was well below the 15,434,086 average, and the OBV is falling. OBV, or on-balance volume, tracks whether volume is flowing into or out of the stock as price moves. A falling OBV while price holds steady suggests that recent gains may not be attracting broad sponsorship. That does not automatically mean weakness, but it does mean the current rise is being asked to do more with less.
Key Levels & Scenarios
The immediate reference points are clear. Support at 152.60 aligns closely with the Bollinger lower band at 152.78 and sits just above the SMA50 at 152.77, creating a dense support cluster. On the upside, resistance at 168.20 stands just under the Bollinger upper band at 169.28 and near the 3-month high at 169.70. That clustering makes the zone between 168.20 and 169.70 the market’s real test area.
If price can move through 168.20 with stronger participation, the chart would shift from a contained uptrend to a more convincing extension toward the recent high area. If price slips back through 161.03, it would signal that the current position at the middle of the Bollinger structure is losing support. And if 152.60 gives way, the whole short-term bullish structure would be damaged because that level sits on top of both the SMA50 and the lower band.
Technical Verdict: HOLD (wait & see)
HOLD (wait & see) fits the chart best because price is still above the SMA20 and SMA50, but MACD remains negative versus its signal line and volume is thin, which weakens confirmation of the uptrend. The RSI is neutral and the Bollinger Bands are normal-width, so there is no strong overbought or breakout signal to force a more aggressive stance. The verdict would be invalidated if price falls below 152.60, where support, the SMA50, and the lower Bollinger band converge.
- Ideal Entry Range: 152.60 to 161.03
- Exit Target: 168.20 to 169.70
- Stop Loss Protection: below 152.60
For non-traders, this means HSBC’s chart still looks stable, but the next move needs stronger volume to prove the recent rise is real.
8,270,003 shares traded last session versus a 15,434,086-share average.
Summary Data HSBC
| Last price | 161.70 HKD |
| Change 1 day / 5 days / 1 month | 0.31% / -3.86% / 5.14% |
| Trend / MA-cross | uptrend / none |
| SMA20 / SMA50 | 161.03 / 152.77 |
| RSI (14) / Stochastic %K | 58.6 / 41.9 |
| Bollinger %B / ATR | 54% / 3.19 |
| Support / Resistance 20 days | 152.60 / 168.20 |
| Data as of | 10 Agustus 2026 08:30 WIB |


