OCBC Stock Analysis: Gains 6.92%, RSI Overbought
On Agustus 12, 2026: price 31.36 SGD, trend uptrend, RSI 72.6, support 27.48, resistance 30.30. technical analysis of ocbc stock. OCBC Stock Analysis — full…

OCBC Bank’s shares on SGX jumped to SGD 31.36, up 6.92% in a single session, after extending a one-month gain of 14.33%. The move matters not just because it is large, but because it has pushed the stock well beyond its recent trading band: the price is now above the upper Bollinger Band at SGD 30.06, a sign that momentum has accelerated faster than the average pace of the past 20 sessions. As shown in the chart, the market is no longer probing for direction; it is already pressing into overextended territory.
Trend & Price Action
The broader structure remains constructive. OCBC is in an uptrend, with the 20-day moving average rising at 2.21% over five days, and the share price holding above both the SMA20 at SGD 28.88 and the SMA50 at SGD 26.40. That positioning usually tells traders that buyers have been willing to pay progressively higher prices, and that the medium-term trend is still intact. There is no fresh moving-average crossover, so the chart is not flashing a brand-new trend signal; instead, it is showing a trend that has already matured and is now being stretched.
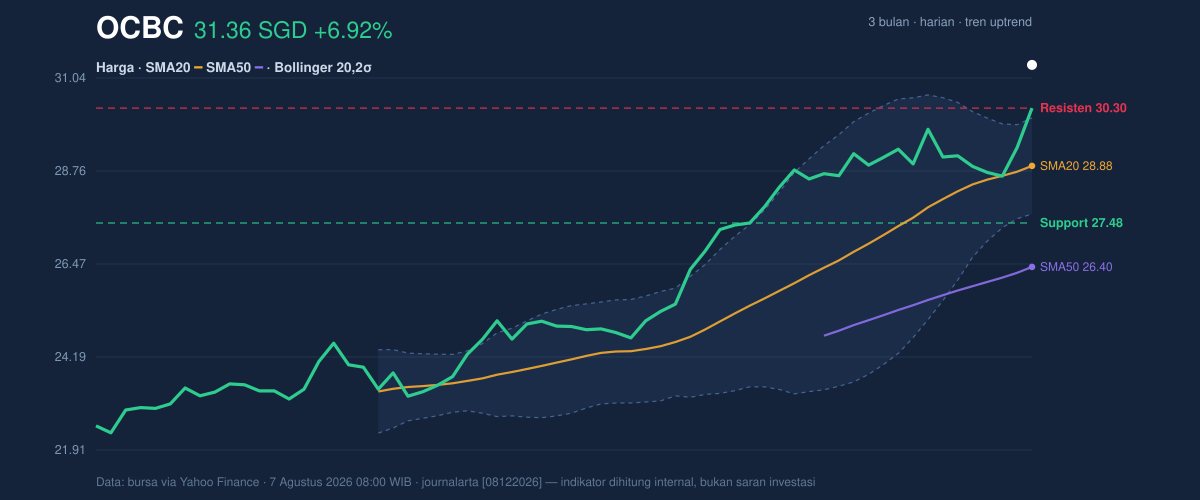
The significance of the latest move is that the stock is trading at 138% of its 20-day support-resistance range, with the 20-day resistance at SGD 30.30 already exceeded. In plain language, OCBC has moved beyond the area where it recently encountered selling pressure, which can indicate either strong breakout demand or a short-term exhaustion phase. The difference will be decided by whether the price can keep holding above the breakout zone rather than slipping back into it.
Oscillators & Momentum
The momentum picture is less comfortable than the price chart alone suggests. The RSI at 72.6 is in overbought territory, while the Stochastic %K at 91.1 and %D at 62.2 also point to a stretched near-term condition. These readings do not mean the stock must fall immediately, but they do mean the rally has become crowded and vulnerable to pauses or pullbacks. When both RSI and Stochastic are elevated at the same time, the market is often telling readers that upside has been rapid enough to leave little room for error.
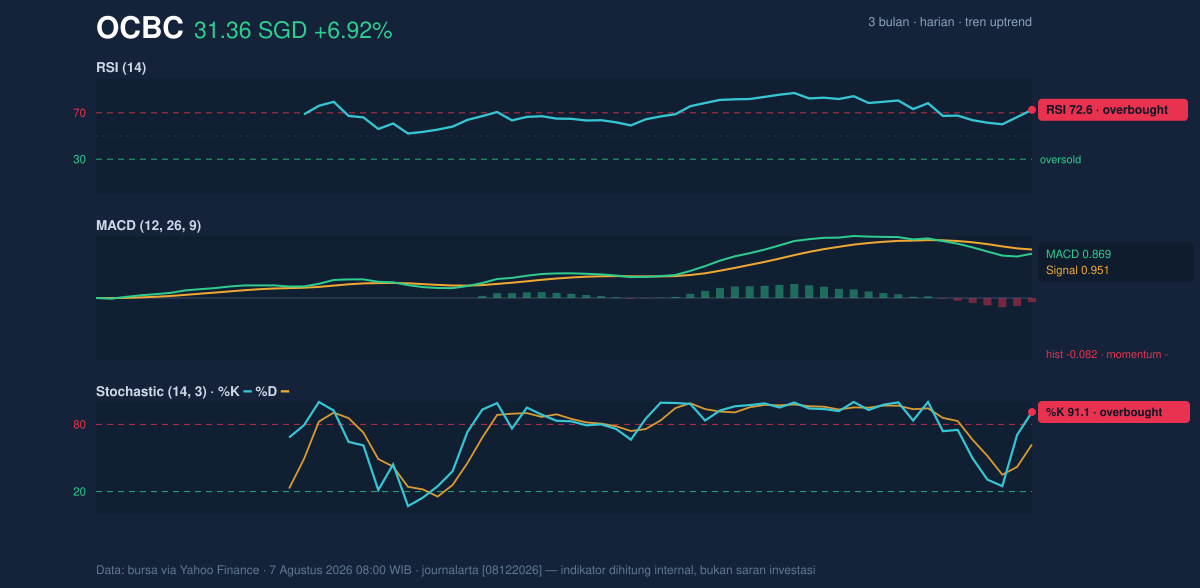
More importantly, the MACD at 0.869 sits below its signal line at 0.951, with a negative histogram of -0.082. That combination is a subtle but important warning: price is still rising, yet the internal pace of momentum has started to lag. This is the kind of divergence that often appears near short-term peaks or during consolidation after a sharp run. It does not reverse the uptrend by itself, but it suggests the latest surge may be losing some of its thrust.
Volatility & Volume
Volatility is elevated, but not extreme. The ATR(14) of 0.62, equal to about 2.0% of the share price, indicates that daily swings are still manageable for a large-cap bank name. Bollinger Band width at 8.2% is described as normal, so this is not a volatility squeeze waiting to explode; rather, the stock is already moving with enough force to challenge the upper edge of its range. The key signal here is that price is pushing outside the band while volatility remains contained, which often happens in strong trend days — and sometimes just before a cooling-off period.
Volume supports the breakout attempt. The latest turnover of 12,029,000 shares is about 1.8 times the 20-session average of 6,833,945, and OBV is rising. That matters because a price move backed by heavier participation is usually more credible than one produced on thin trading. In this case, the volume surge suggests real buying interest rather than a purely mechanical lift, even if momentum indicators say the move is already getting stretched.
Key Levels & Scenarios
The nearest support to watch is the 20-day support around SGD 27.48, while the immediate breakout area sits at SGD 30.30. The stock is now trading above both, which means those levels have shifted from active barriers into reference points for whether the move is holding together. The more distant benchmark is the 3-month high at SGD 30.50, which has now been overtaken; that is a meaningful signal because it shows the market has broken out of its recent ceiling rather than merely testing it.
If OCBC stays above SGD 30.30, the chart suggests the breakout remains intact and the current overbought readings may simply reflect strong trend extension. If it slips back below that level, traders will likely view the move as a failed breakout and reassess whether the rally can be sustained. A deeper loss of traction would come if price falls through SGD 28.88, the SMA20, because that would signal the stock is no longer comfortably holding its short-term trend line.
Technical Verdict: HOLD (wait & see)
HOLD (wait & see) is the clearest technical reading because the trend is strong, but momentum is overstretched and starting to soften.
- Reason 1: The price remains above the SMA20 at SGD 28.88 and SMA50 at SGD 26.40, confirming the uptrend.
- Reason 2: RSI 72.6 and Stochastic %K 91.1 / %D 62.2 show the stock is overbought, which raises the risk of near-term cooling.
- Reason 3: MACD 0.869 below signal 0.951 with a -0.082 histogram suggests momentum is no longer fully aligned with price strength.
- Verdict invalidated if price breaks below SGD 27.48, which would mean the short-term support structure has failed.
- Ideal Entry Range: SGD 28.88 to SGD 30.30
- Exit Target: SGD 30.50
- Stop Loss protection: Below SGD 27.48
For non-traders, this means the stock is still in a strong upward phase, but it looks stretched enough that patience may be more useful than chasing the latest surge. The next market test is whether OCBC can keep holding above SGD 30.30 after the breakout through SGD 30.50.
Summary Data OCBC
| Last price | 31.36 SGD |
| Change 1 day / 5 days / 1 month | 6.92% / 7.66% / 14.33% |
| Trend / MA-cross | uptrend / none |
| SMA20 / SMA50 | 28.88 / 26.40 |
| RSI (14) / Stochastic %K | 72.6 / 91.1 |
| Bollinger %B / ATR | 155% / 0.62 |
| Support / Resistance 20 days | 27.48 / 30.30 |
| Data as of | 7 Agustus 2026 08:00 WIB |

