T Stock Technicals Today: Gains 1.87%, Golden Cross Formed
On Agustus 12, 2026: price 24.50 USD, trend uptrend, RSI 63.9, support 21.43, resistance 24.66. technical analysis of t stock. Stock Technicals — full details…
By Alistair Sterling
August 12, 20265 min read
T Stock Technicals Today: Gains 1.87%, Golden Cross Formed
At 24.50 USD, AT&T is trading just below a near-term ceiling while still holding above its short- and medium-term trend lines. The move matters because it is not just a bounce: the stock is sitting in an established uptrend, with a golden cross in place and momentum still positive, even as the latest session closed with volume well below average.
Trend & Price Action
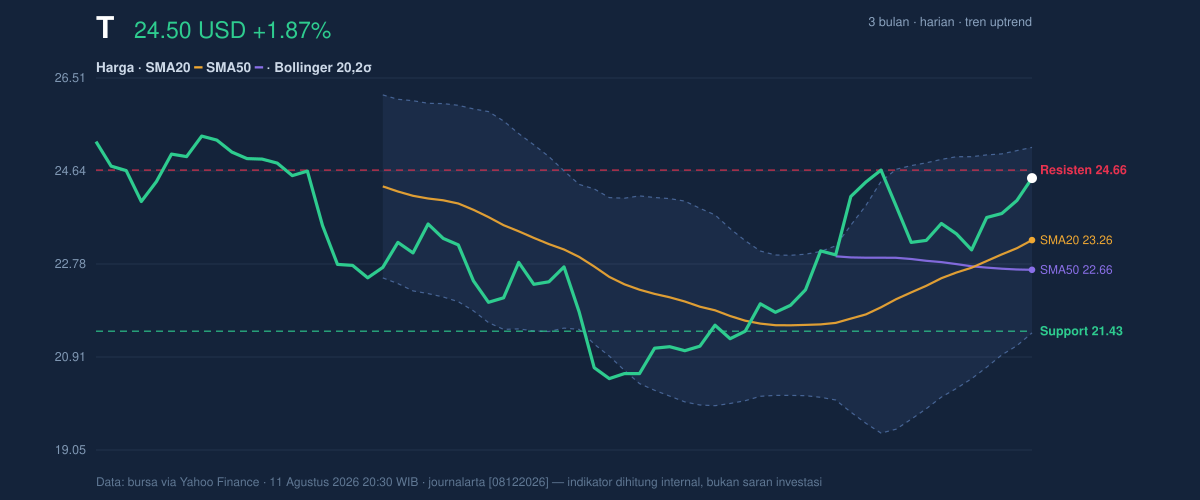
AT&T’s share price is now above both the SMA20 at 23.26 and the SMA50 at 22.66, which is the classic sign that recent buying pressure has overtaken the slower trend. The golden cross — when the shorter moving average rises above the longer one — usually tells traders that the market has shifted from repair mode into trend-following mode. In plain English, it means the stock is no longer merely stabilizing; it is being carried by a stronger short-term direction.
The slope of the SMA20, up 2.87% over 5 days, confirms that the trend is still pointing higher rather than flattening out. That said, the stock is also trading near the top of its recent range, with 24.66 marked as resistance and the price at roughly 95% of the 20-hour range. As shown in the chart, this is the kind of positioning that can either lead to a breakout attempt or to a pause if buyers fail to extend the move.
3-month price action chart of T: price, SMA20/50, Bollinger, support & resistance. Data: exchange via Yahoo Finance.
The broader range adds context. AT&T is trading below its 3-month high of 25.55 but well above the 3-month low of 19.89. That gap suggests the market has already rewarded the recovery, but has not yet fully priced in a return to the upper end of the range.
Oscillators & Momentum
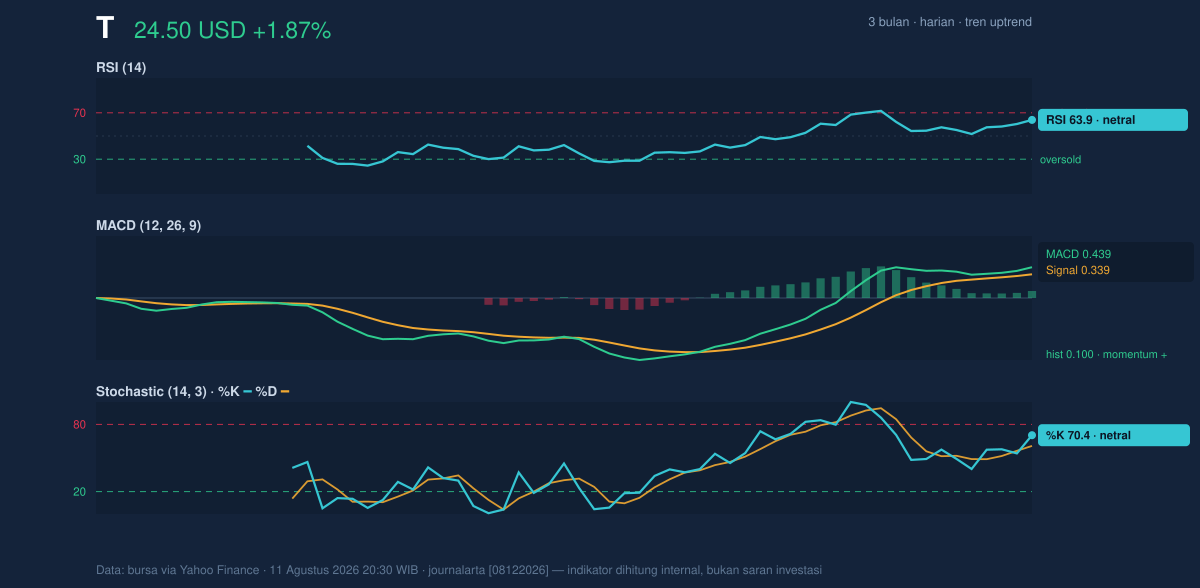
Momentum chart of T: RSI(14), MACD, Stochastic. Data: exchange via Yahoo Finance.
The momentum picture is constructive, but not overheated. The RSI at 63.9 is described as neutral, which matters because it shows the stock has room to extend without immediately entering an overbought zone. RSI is a speed gauge: readings near the upper end tell you buyers are active, but not yet stretched enough to force a reversal on their own.
The Stochastic %K at 70.4 and %D at 60.8 also sit in neutral territory, though close enough to the upper band to suggest the stock is leaning toward the stronger side of its recent range. Stochastic tends to react faster than RSI, so this positioning often signals that price is pressing upward, but not in a runaway fashion.
The strongest confirmation comes from the MACD at 0.439, above its signal line at 0.339, with a positive histogram of 0.100. That alignment means the trend’s internal momentum is still positive: the faster trend measure is ahead of the slower one, and the gap between them is still in favor of buyers. In practical terms, the chart is not showing a bearish divergence yet; it is showing a trend that remains supported by momentum.
Volatility & Volume
The Bollinger setup is telling a more nuanced story. Price is near the upper band at 25.12, with %B at 83%. %B measures where price sits inside the Bollinger envelope, so a reading this high means AT&T is trading close to the top of its recent volatility channel. That usually reflects strength, but it also means the stock is closer to a point where enthusiasm can cool if fresh demand does not appear.
The Bollinger band width of 16.0% is described as normal, not compressed. That matters because it suggests the stock is not sitting in a volatility squeeze that would often precede a sharp breakout. Instead, the market already has some room to move, and the next leg will likely depend on whether buyers can absorb supply near resistance.
Volume is the one clear caution. The latest turnover was 35,127,100, about 0.5x the 20-day average of 74,629,010. That is a quiet session for a stock testing the upper part of its range. Low volume does not negate the uptrend, but it does weaken the signal from the price move: rallies are more convincing when they come with broad participation. The OBV is rising, though, which suggests the broader accumulation trend has not broken down even if the latest session was muted.
Key Levels & Scenarios
The market is now working between a floor at 21.43 and resistance at 24.66. With price at 24.50, AT&T is effectively testing the upper end of that corridor. If the stock can clear 24.66, the chart would open a path toward the 25.12 Bollinger upper band and then the 25.55 three-month high. If it fails to hold the current advance, the first meaningful area to watch is the 23.26 SMA20, which now acts as dynamic support.
The signal is straightforward: trend, moving averages and MACD are aligned in a bullish structure, but volume is not yet confirming conviction at the top of the range.
Technical Verdict: HOLD (wait & see)
- Strongest reasons:
- Golden cross and price above both SMA20 and SMA50 support the uptrend.
- MACD is positive and above its signal line, showing momentum is still constructive.
- %B at 83% shows price is near the upper Bollinger band, which is bullish but also near a decision point.
- Invalidation condition: this verdict is invalidated if price falls below 21.43, the 20-hour support.
- Ideal Entry Range: 23.26 to 24.50, using the SMA20 area into current price strength.
- Exit Target: 24.66 to 25.12, based on resistance and the upper Bollinger band.
- Stop Loss protection: 21.43, aligned with the nearest support.
For non-traders, this means AT&T’s chart is still healthy, but it is now close enough to resistance that the next move needs confirmation more than enthusiasm.