Tencent Stock Drops 1.67% Today, Momentum Gains
On Agustus 12, 2026: price 470.80 HKD, trend uptrend, RSI 56.6, support 434.60, resistance 492.20. technical analysis of tencent stock.

Tencent Holdings was lower on the Hong Kong exchange on 10 August 2026, with Tencent’s HKEX-listed shares at 470.80 HKD, down 1.67% from the previous close of 478.80 HKD, even as the broader technical picture still sits inside an uptrend, as shown in the chart.
The move matters because it is not a clean trend break. Price is still holding above SMA20 at 468.06 and well above SMA50 at 455.28, which means the medium-term structure remains constructive. But the stock is also sitting below the session’s recent recovery highs and has slipped 4.00% over five days, a sign that momentum has cooled after a stronger one-month gain of 2.88%. In plain terms: Tencent is still in an upward channel, but the market is pausing rather than accelerating.
A pause, not a reversal.
Trend & Price Action
The chart shows Tencent trading above its SMA20 and SMA50, a classic sign that buyers have not lost control of the larger trend. The SMA20 slope of 0.99% over five days reinforces that the short-term trend is still rising, which usually helps absorb minor pullbacks. There is no fresh MA-cross, so there is no new moving-average signal forcing a change in stance; that matters because the market is not flipping from bullish to bearish on trend structure alone.
At the same time, the share price is positioned at about 63% of the 20-hour range, between support at 434.60 and resistance at 492.20. That placement tells readers the stock is neither stretched at the top of the range nor washed out near support. It is mid-to-upper range, which often leaves room for either continuation or a pullback if buyers hesitate.
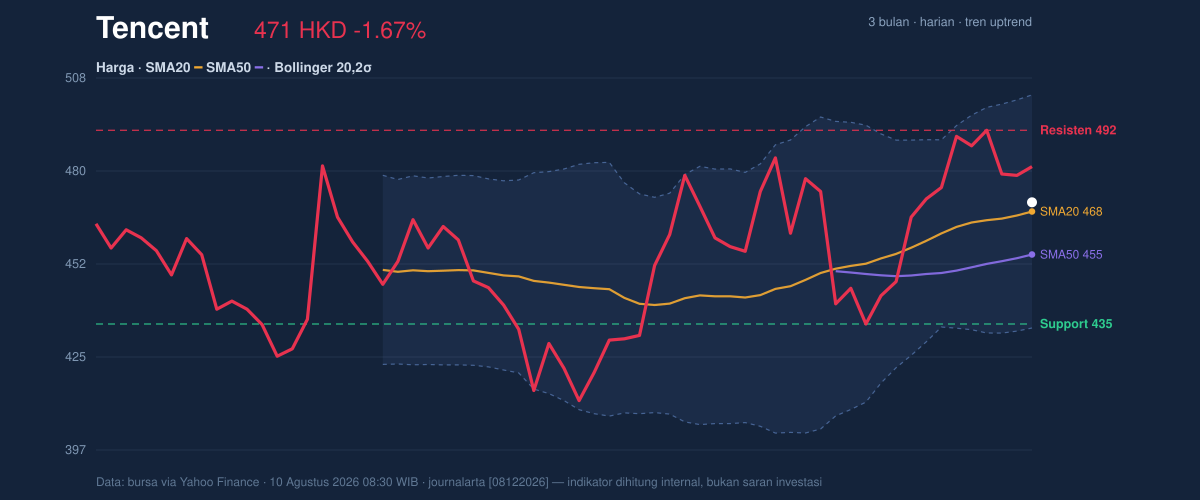
The distance to the upper Bollinger band at 502.73 is also important. With price still below that ceiling and the Bollinger width at 14.8%, volatility is normal rather than compressed or explosive. That suggests the stock is not in a breakout squeeze; it is moving within a fairly orderly band.
Oscillators & Momentum
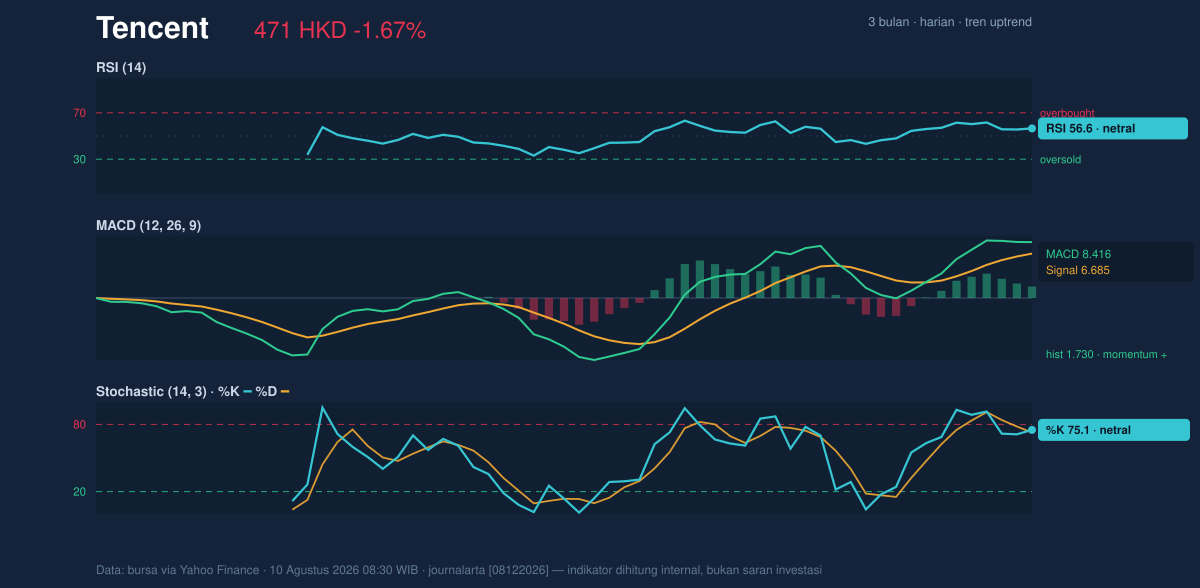
Momentum is mixed, but not damaged. The RSI at 56.6 is neutral, which means Tencent is not overbought and not oversold. That is a useful signal in a stock that has already had a decent one-month run: the market has room to move without immediately running into an exhaustion reading. The Stochastic %K at 75.1 and %D at 72.6 are closer to the upper end of the range, which hints that short-term buyers have been active, but the oscillator is not screaming reversal yet because it is still labeled neutral in this setup.
The more decisive signal comes from MACD. MACD at 8.416 is above its signal line at 6.685, with a positive histogram of 1.730. That configuration means near-term momentum still leans upward even though the price has softened on the day. In other words, Tencent is pulling back inside a still-positive momentum regime, rather than breaking down from one.
Volatility & Volume
Volatility is present but controlled. ATR(14) at 14.74, or 3.1% of price, points to moderate day-to-day movement. That matters because a stock with moderate ATR can drift lower or higher without needing a dramatic catalyst; the current decline does not automatically imply a structural shift. The Bollinger setup also supports that view: price is near the middle of the band, with %B at 54%, which means Tencent is trading just above the band midpoint, not pressing the upper edge and not testing the lower boundary.
Volume, however, is the caution flag. Last volume was 15,508,724, about 0.5× the 20-hour average of 28,866,058. Thin participation on a down day can mean the move is not yet strongly confirmed by sellers, but it also means buyers have not stepped in aggressively enough to reverse it. The one supportive detail is that OBV is rising, which signals that, over time, accumulated volume has still leaned toward buying rather than distribution. That divergence — quieter trading today, but rising cumulative volume — is why the chart still reads as constructive rather than broken.
Key Levels & Scenarios
The nearest technical map is clear. Support at 434.60 is the first line that matters if weakness deepens. Below that, the 3-month low at 411.00 becomes the broader downside reference. On the upside, resistance at 492.20 is the immediate barrier, while the 3-month high at 497.80 sits just above it and the upper Bollinger band at 502.73 defines the next technical ceiling.
If Tencent can reclaim and hold above 492.20, the price would be challenging the upper part of the range where sellers have recently appeared. If it fails to hold 468.06, the SMA20 midpoint becomes a key test of whether the current uptrend is merely pausing or starting to lose slope. If 434.60 gives way, the chart would shift from a normal pullback into a more serious retracement toward the 3-month low.
Technical Verdict: HOLD (wait & see)
HOLD (wait & see)
- MACD is still positive, with the line above signal and a positive histogram, which keeps the short-term momentum constructive.
- Price remains above SMA20 and SMA50, so the broader trend structure has not turned lower.
- Volume is only 0.5× average, which weakens conviction on the latest move and argues against treating the dip as a decisive signal.
Verdict invalidated if price breaks below 434.60, because that would mean the nearest support has failed and the current range structure has been damaged.
- Ideal Entry Range: 468.06 to 470.80, where price is near the SMA20 and the current market level.
- Exit Target (Target Price): 492.20 to 497.80, aligned with resistance and the 3-month high.
- Stop Loss protection: below 434.60, the nearest support; more conservatively, below 433.39, the lower Bollinger band.
For non-traders: Tencent still looks technically steady, but the latest dip says the market wants proof before extending the move.
“The chart is not broken, but it is asking a harder question now: can buyers defend the middle of the range?”
Summary Data Tencent
| Last price | 470.80 HKD |
| Change 1 day / 5 days / 1 month | -1.67% / -4.00% / 2.88% |
| Trend / MA-cross | uptrend / none |
| SMA20 / SMA50 | 468.06 / 455.28 |
| RSI (14) / Stochastic %K | 56.6 / 75.1 |
| Bollinger %B / ATR | 54% / 14.74 |
| Support / Resistance 20 days | 434.60 / 492.20 |
| Data as of | 10 Agustus 2026 08:30 WIB |


