Testing Key Resistance, Shell Stock Gains 2.40% Today
On Agustus 12, 2026: price 3,356.00 GBp, trend uptrend, RSI 56.2, support 3,129.50, resistance 3,405.50. technical analysis of shell stock.

Shell plc edged higher on the London Stock Exchange on 10 August 2026, with the shares last changing hands at 3,356.00 GBp, up 2.40% on the day, but the move came on 0.6x normal volume, a sign that buyers were present without broad participation.
The price action matters because Shell is still trading in an established uptrend, yet the latest push is happening after a weak five-day stretch of -1.45%. That combination usually means the market is not rejecting the broader trend, but it is also not showing the kind of force that typically accompanies a decisive breakout. In plain terms: the shares are climbing, but the climb is being tested.
Trend & Price Action
Shell remains above both major trend guides, with the SMA20 at 3,276.18 and the SMA50 at 3,144.70. That positioning keeps the medium-term structure constructive, and the SMA20 slope of 1.89% over five days shows the shorter trend is still pointing higher. As shown in the chart, the stock is also sitting near the upper part of its recent band, at 82% of the 20-day range, which usually means the market is pricing in strength but has not yet fully escaped the current corridor.
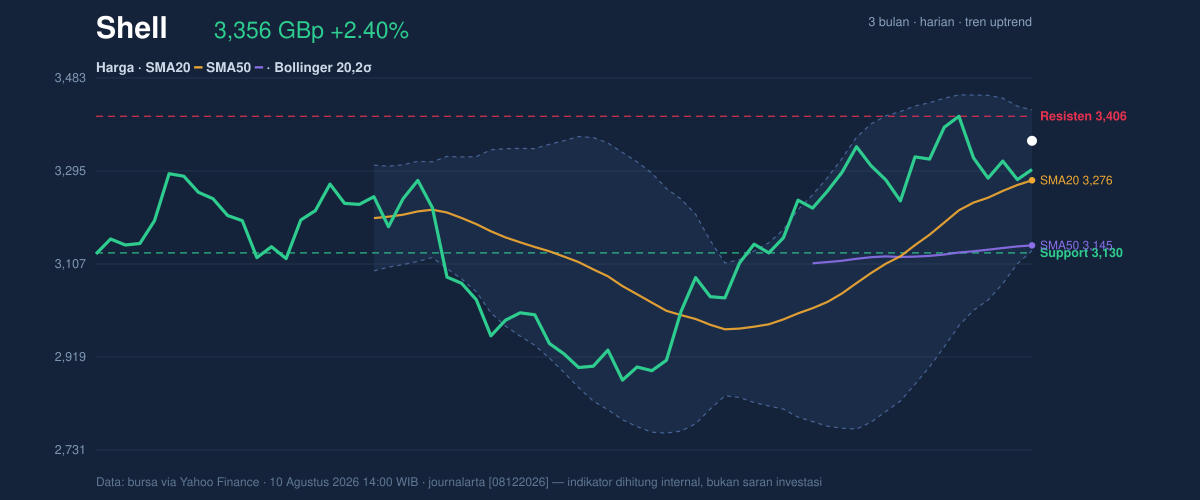
The Bollinger Bands add an important layer. With the upper band at 3,418.15, the middle band at 3,276.18, and the lower band at 3,134.20, Shell is trading above the midpoint and below the upper boundary, with %B at 78%. That tells us price is leaning toward the top of the recent range, but not in a stretched or breakout state. The 8.7% band width is described as normal, so volatility is not compressed enough to suggest an imminent squeeze, nor expanded enough to imply panic or a climactic move.
Oscillators & Momentum
The momentum picture is more mixed than the trend picture. The RSI at 56.2 sits in neutral territory, which means Shell is neither overbought nor oversold; it is simply holding a modestly positive tone. The Stochastic %K at 34.7 and %D at 40.9 also remain neutral, but they are lower than the price structure might suggest, which hints that short-term momentum has not fully caught up with the share price.
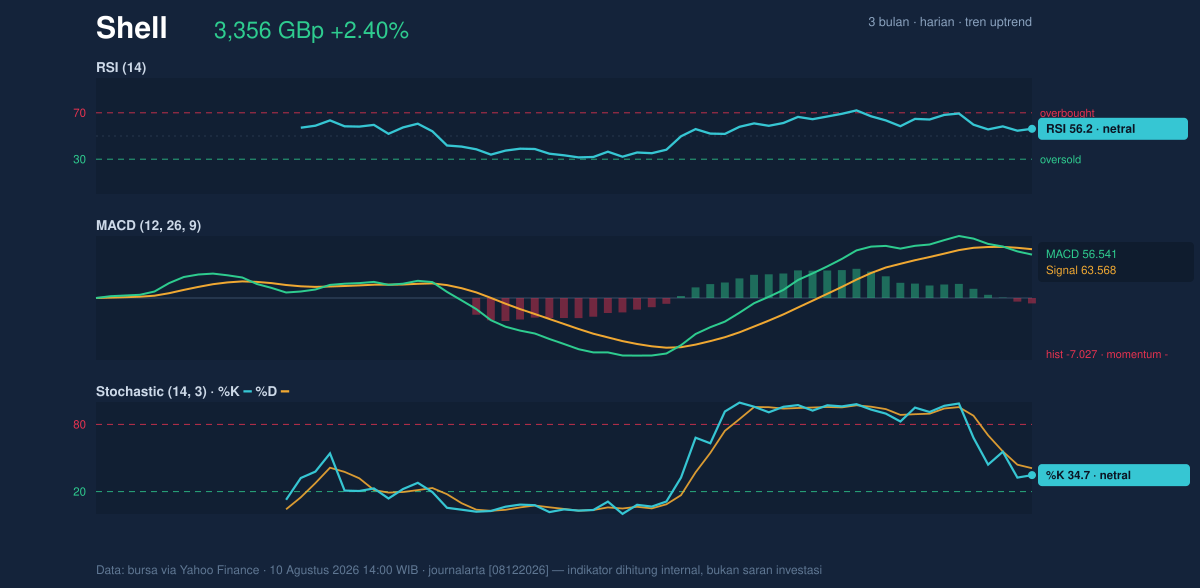
The clearest warning comes from the MACD. At 56.541 versus a signal line of 63.568, with a -7.027 histogram, the indicator is still negative. That matters because MACD is often used to judge whether the trend has enough internal strength to sustain itself. Here, the answer is not yet fully convincing: the shares are above key averages, but the trend’s internal engine is running below the signal line. In practical terms, that often shows up when a rally is intact, but momentum is fading or pausing before the next leg.
Volatility & Volume
Average true range, or ATR, is 73.80, equal to 2.2% of price, which points to moderate volatility. That is useful because it frames how far Shell can reasonably move in a session without needing a major catalyst. A move of this size is enough to test nearby support or resistance, but not so large that the chart is behaving erratically.
Volume is less supportive. Last turnover of 5,651,451 compares with a 20-day average of 8,995,793, leaving activity at 0.6x normal. The OBV is falling, which suggests that cumulative volume has not been confirming the price rise. That divergence is important: when price rises while OBV slips, it often means the move is being carried by fewer committed buyers. It does not cancel the trend, but it does reduce confidence in the durability of the advance.
Key Levels & Scenarios
The nearest support is 3,129.50 and the nearest resistance is 3,405.50. Shell is currently closer to resistance than support, which means the market is testing the upper side of the range rather than rebuilding from the floor. The distance to resistance is modest, while the distance to support is larger, so the shares are positioned where a breakout attempt or a pullback can happen quickly.
The broader reference points also matter. The 3-month high is 3,758.50 and the 3-month low is 2,559.50. That wide span shows Shell has already recovered meaningfully from the lower end of the range, but it also reminds readers that the stock is still below the recent peak. If the shares can clear 3,405.50 with stronger participation, the chart would look more convincing, especially if MACD begins to improve. If instead the price slips back through the 3,276.18 area, the middle Bollinger band and SMA20 would become the first line of defense. A break below 3,129.50 would do more damage to the current structure and would suggest the recent advance is losing traction.
Technical Verdict: HOLD (wait & see)
HOLD (wait & see)
- Reason 1: Price remains above the SMA20 and SMA50, so the broader trend is still positive.
- Reason 2: MACD is negative and OBV is falling, which means the rally is not yet backed by strong internal momentum or volume.
- Reason 3: RSI 56.2 and Stochastic 34.7/40.9 are neutral, so there is no strong overbought or oversold signal to force a more aggressive stance.
- Verdict invalidated if price breaks below 3,129.50, because that would undercut the nearest support and weaken the current uptrend structure.
- Ideal Entry Range: 3,276.18 to 3,405.50
- Exit Target: 3,418.15
- Stop Loss protection: 3,129.50
In plain English, Shell’s chart still points upward, but the latest rise looks more like a cautious step than a decisive breakout. “The market is asking for proof, not just price.”
Summary Data Shell
| Last price | 3,356.00 GBp |
| Change 1 day / 5 days / 1 month | 2.40% / -1.45% / 7.94% |
| Trend / MA-cross | uptrend / none |
| SMA20 / SMA50 | 3,276.18 / 3,144.70 |
| RSI (14) / Stochastic %K | 56.2 / 34.7 |
| Bollinger %B / ATR | 78% / 73.80 |
| Support / Resistance 20 days | 3,129.50 / 3,405.50 |
| Data as of | 10 Agustus 2026 14:00 WIB |

