Testing Support Level, Singtel Stock Drops 0.69% Today
On Agustus 12, 2026: price 4.31 SGD, trend sideways, RSI 39.4, support 4.30, resistance 4.61. technical analysis of singtel stock. Testing Support Level — full…

Singtel fell to SGD 4.31 on SGX on 7 August 2026, slipping 0.69% from the previous close of SGD 4.34 as the stock drifted back toward the lower end of its recent trading band. The move matters less as a one-day drop than as a signal of where the share is trading inside its range: the price is now sitting just above near-term support, while momentum remains weak enough to keep the market in a cautious, wait-and-see posture.
Trend & Price Action
The chart shows a stock that is still moving sideways, but with a slight downward bias in the short term. Price is below the SMA20 at SGD 4.43, which tells traders that the latest trading is still weaker than the recent average and that short-term sellers have not fully lost control. At the same time, SMA50 at SGD 4.39 sits just above the current price, so the longer short-term trend is not deeply broken, but it is no longer giving a clean bullish signal either.
That positioning is important. When a share trades below the faster average but near the slower one, it often means the market is undecided rather than trending strongly. There is also no fresh MA cross, so the chart does not yet show a new trend reversal signal. Instead, Singtel is compressing inside a narrow band, and that usually means traders are waiting for a catalyst before committing more capital.
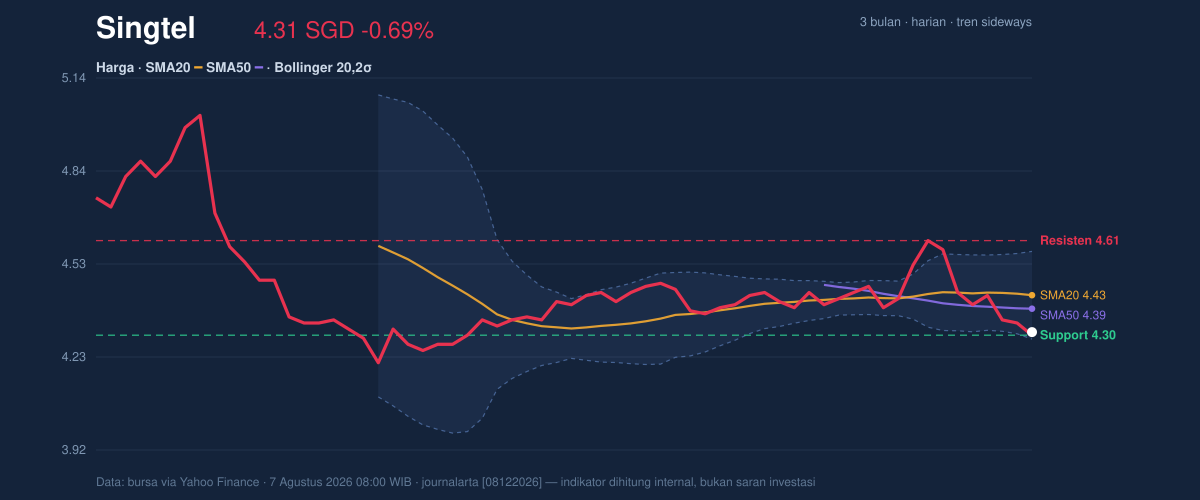
The Bollinger setup reinforces that reading. The lower band at SGD 4.29 is very close to the last price, while the middle band at SGD 4.43 lines up with the SMA20. With %B at 8%, the price is hugging the bottom of the band structure, which usually means the stock is trading near the lower edge of its recent statistical range. That does not automatically mean reversal, but it does show the market is pricing in weakness rather than strength.
The band width at 6.5% is also narrow, which signals a squeeze. In plain English, that means volatility has contracted and the next meaningful move could be sharper than the recent daily drift. The stock is not necessarily ready to break out immediately, but compressed volatility often precedes a stronger directional move once volume returns.
Oscillators & Momentum
Momentum indicators are mixed, and that is the key reason the chart does not yet support a strong directional call. RSI at 39.4 is still in neutral territory, but it is leaning weak. RSI measures whether a stock has been bought too aggressively or sold too heavily; here, it says the market has not reached an extreme, but it is closer to the lower end of normal than the middle. That fits a stock that is soft, not one that is collapsing.
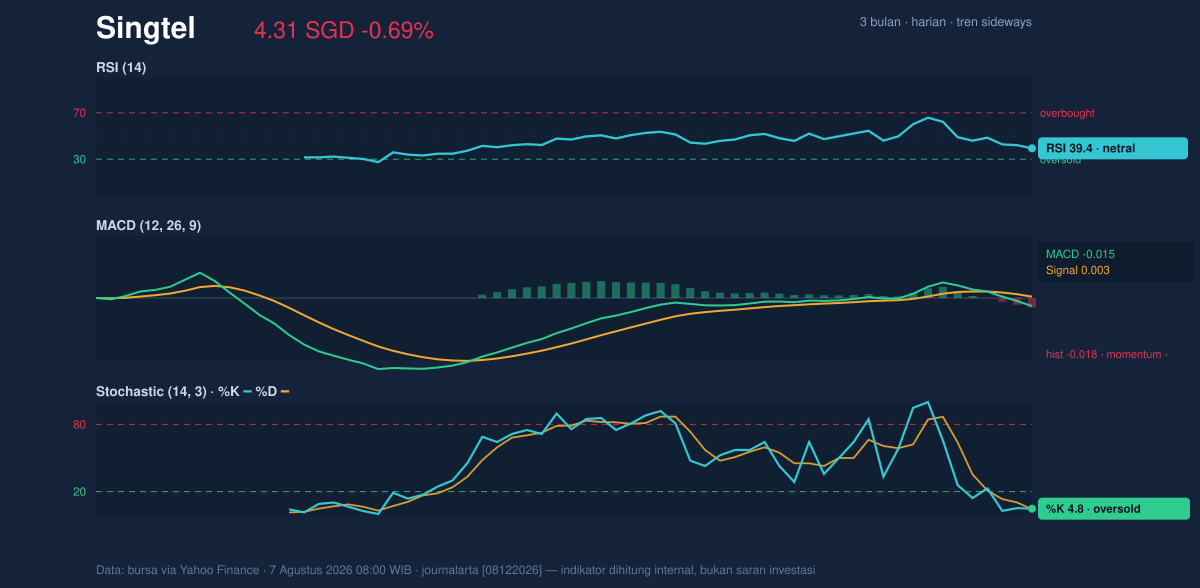
The more immediate signal comes from stochastic, where %K at 4.8 and %D at 4.3 are both in oversold territory. Stochastic compares the latest price with its recent range, so readings this low usually mean the stock has been pushed down quickly relative to where it has traded recently. That can sometimes precede a bounce, but only if price action and volume start to confirm it. Right now, that confirmation is missing.
MACD is still negative. MACD at -0.015, below its signal at 0.003, with a histogram of -0.018, shows that downside momentum still outweighs upside momentum. MACD is useful because it captures trend acceleration; when it stays below the signal line, it suggests the market has not yet shifted back into a stronger recovery phase. So while stochastic is oversold, MACD says the downtrend pressure has not fully exhausted itself.
Volatility & Volume
The volatility picture is moderate rather than dramatic. ATR at 0.09, or 2.2% of price, means the stock is still moving enough to matter, but not with the kind of extreme swings that usually accompany panic or euphoria. Combined with the Bollinger squeeze, that suggests the market is coiling rather than expanding.
Volume does not yet confirm a decisive move. Last volume of 29,689,500 was below the 20-hour average of 32,177,085, or about 0.9× normal. That matters because breakouts and breakdowns are more credible when volume rises with the move. Here, the market is losing altitude on slightly lighter participation, which makes the decline look more like a cautious unwind than an aggressive selloff.
OBV is also falling. On-balance volume tracks whether money is flowing into or out of a stock, and a declining OBV says the balance of participation still favors distribution over accumulation. In other words, traders have not yet shown enough demand to reverse the recent softness.
Key Levels & Scenarios
The nearest technical floor is support at SGD 4.30. That level is critical because the stock is already trading just above it, and the current price sits in the lower part of the recent range. If that floor holds, the oversold stochastic reading could help stabilize the share and keep it inside the current band.
The first ceiling is resistance at SGD 4.61. That level matters because it marks the top of the recent 20-hour range and would need to be cleared before the chart could start looking constructive again. Between those two levels, the stock is trading close to the bottom of the range, with little room for error if sellers press further.
The broader 3-month range adds context: 3-month high at SGD 5.05 and 3-month low at SGD 4.15. The share is still above that low, but it is much closer to the lower end of the broader range than to the top, which confirms that the recent recovery attempt has not yet regained full traction.
Technical Verdict: HOLD (wait & see)
HOLD (wait & see)
- RSI at 39.4 is weak but not deeply oversold, so the stock is not at a clear technical reset.
- MACD is negative and still below its signal line, which says downside momentum has not fully cleared.
- Bollinger bands are squeezing and %B at 8% shows price is near the lower band, so the next move could be sharp but is not yet confirmed.
Verdict invalidated if price breaks below SGD 4.30, because that would put the stock beneath immediate support and increase the risk of a deeper move toward the recent low.
- Ideal Entry Range: SGD 4.29 to 4.31
- Exit Target: SGD 4.43 to 4.61
- Stop Loss: below SGD 4.30
For non-traders, this means Singtel is close to a technical floor, but the chart has not yet shown enough strength to call the move repaired.
Summary Data Singtel
| Last price | 4.31 SGD |
| Change 1 day / 5 days / 1 month | -0.69% / -2.93% / -2.05% |
| Trend / MA-cross | sideways / none |
| SMA20 / SMA50 | 4.43 / 4.39 |
| RSI (14) / Stochastic %K | 39.4 / 4.8 |
| Bollinger %B / ATR | 8% / 0.09 |
| Support / Resistance 20 days | 4.30 / 4.61 |
| Data as of | 7 Agustus 2026 08:00 WIB |


