UOB Stock Drops 3.26% Today, Testing Support Level
On Agustus 12, 2026: price 42.16 SGD, trend sideways, RSI 56.5, support 42.47, resistance 44.95. technical analysis of uob stock. UOB Stock Drops — full…

United Overseas Bank fell to SGD 42.16 on SGX, down 3.26% from the previous close of SGD 43.58, and the move matters because it pushed the stock below its SMA20 at SGD 43.40 even as the broader structure remains described as sideways. That combination usually signals a market that is not trending cleanly in either direction: the short-term tone has weakened, but the longer moving average at SGD 41.17 still sits underneath price, so the tape has not yet rolled into a full bearish breakdown.
Trend & Price Action
The chart shows UOB trading in the lower half of its recent range, with the last price sitting about 13% below the 20-hour resistance band and only just above the lower Bollinger line. The stock’s sideways trend is reinforced by the SMA20 slope of 0.23% over 5 days, which is modest enough to suggest consolidation rather than a decisive directional move. There is no fresh MA-cross, and that absence is important: it means the market has not produced a new medium-term trend signal, so the recent weakness is better read as pressure inside a range rather than a confirmed downtrend.
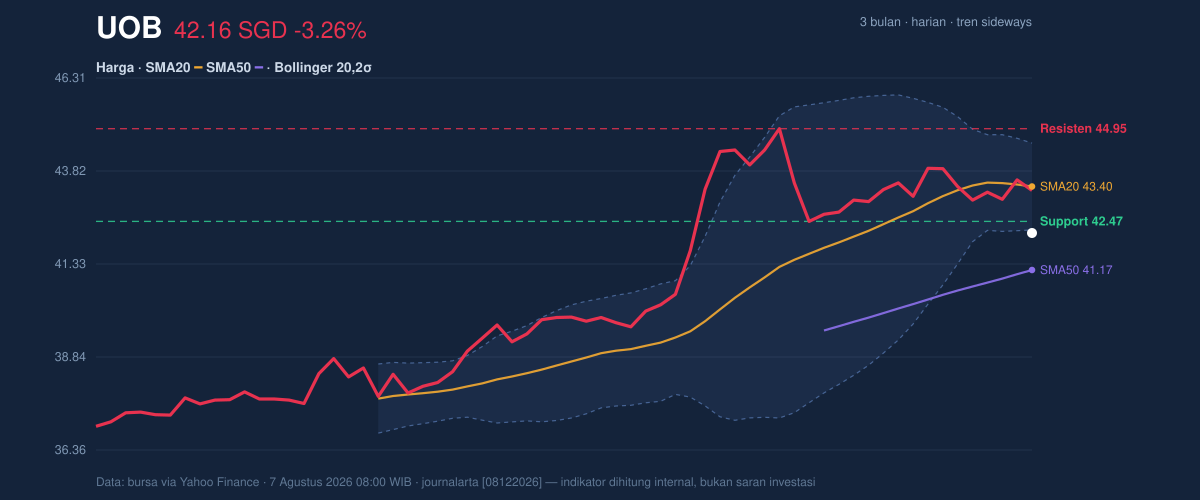
The key price structure is tight. Support at SGD 42.47 is now the nearest reference point, while resistance at SGD 44.95 marks the upper boundary of the recent range. UOB’s 3-month high of SGD 45.15 and 3-month low of SGD 36.65 frame a broad band, but the current action is clustered near the middle-lower portion of that span, which usually means traders are waiting for a catalyst before committing to a larger move. The fact that price is below the SMA20 but above the SMA50 at SGD 41.17 leaves the stock in a technically mixed position: short-term softness, medium-term support.
Oscillators & Momentum
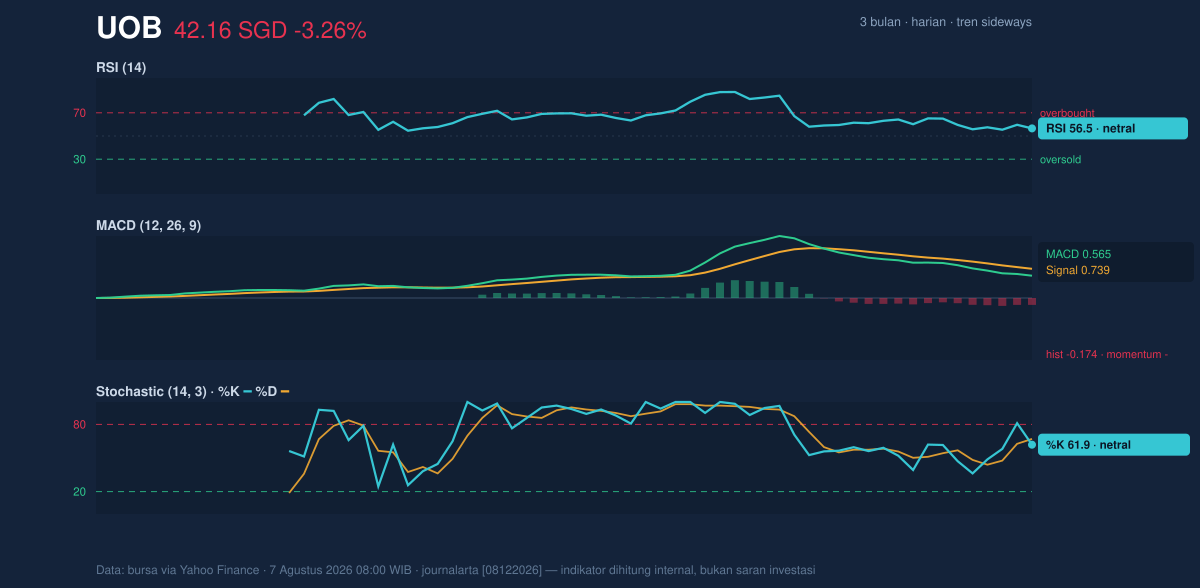
Momentum indicators are not giving a strong trend confirmation. RSI at 56.5 is neutral, which tells readers the stock is neither stretched nor washed out; it is simply not showing urgency. Stochastic %K at 61.9 and %D at 67.0 are also neutral, with no obvious oversold signal to suggest a rebound is already underway. The more important clue comes from MACD at 0.565 versus signal at 0.739, with a histogram of -0.174. That negative histogram means the shorter-term momentum line has slipped below its trigger line, a classic sign that upward force is fading even though the broader trend has not yet fully turned down.
The message from these oscillators is subtle but clear: the stock is not oversold, so weakness has not reached a point where a reflex bounce is technically forced. At the same time, momentum is not strong enough to justify calling the pullback a healthy pause. It is a pause with a slight downside bias.
Volatility & Volume
The Bollinger Bands add another layer to that reading. With the upper band at SGD 44.56, the middle band at SGD 43.40, and the lower band at SGD 42.24, the last price at SGD 42.16 sits just below the lower band. That is notable because it often signals a market probing the lower edge of its recent statistical range. The %B of -4% is an extension below the band, which can happen when price moves quickly through support rather than smoothly within it. More importantly, the band width is only 5.3% and is narrowing, which points to a squeeze-like setup: volatility is compressing, and compressed volatility often precedes a sharper move once price chooses a direction.
Volume confirms that this move is not happening in a vacuum. The latest turnover of 6,542,300 is about 1.8 times the 20-hour average of 3,543,178, so the selloff came with participation rather than fading interest. That matters because heavy volume on a down day usually means the market is actively repricing the stock, not merely drifting. Yet OBV is falling, which shows that cumulative money flow is still leaning out of the name even while the stock remains above the SMA50. In plain English, buyers are present, but sellers have the louder voice for now.
Key Levels & Scenarios
The immediate technical question is whether SGD 42.47 support can hold after the latest close at SGD 42.16. If the stock stabilizes back above that area, the first test becomes the SGD 43.40 SMA20, which is also the Bollinger middle line and therefore a useful checkpoint for whether the recent weakness is being absorbed. A move through that zone would reduce the pressure from the current lower-band drift and shift attention toward SGD 44.56 and then SGD 44.95 resistance. If price fails to reclaim the SMA20 and instead continues to trade below SGD 42.47, the next layer of support sits at the SGD 41.17 SMA50, a level that would become the line separating a routine pullback from a more meaningful deterioration.
The chart setup is therefore less about direction certainty and more about compression. Narrow bands, neutral oscillators, and a volume-backed dip often produce a decisive move later, but the indicators do not yet tell us which side will win.
Technical Verdict: HOLD (wait & see)
HOLD (wait & see)
- MACD histogram at -0.174 shows momentum has turned negative, but not decisively enough to confirm a full trend reversal.
- Price below the SMA20 at SGD 43.40 and just under the lower Bollinger band at SGD 42.24 signals short-term pressure, while RSI 56.5 and Stochastic 61.9/67.0 remain neutral rather than oversold.
- Volume at 1.8× average and falling OBV indicate active selling, yet the SMA50 at SGD 41.17 still acts as nearby structural support.
- Verdict invalidated if price falls below SGD 41.17, which would weaken the medium-term base and shift the setup from range trade to deeper breakdown risk.
- Ideal entry range: SGD 42.47 to SGD 43.40
- Exit target: SGD 44.56 to SGD 44.95
- Stop loss protection: below SGD 41.17
For non-traders, this means UOB is not in a clean uptrend or downtrend right now; it is sitting in a tight technical zone where the next move will matter more than the latest one.
Summary Data UOB
| Last price | 42.16 SGD |
| Change 1 day / 5 days / 1 month | -3.26% / -2.86% / -5.00% |
| Trend / MA-cross | sideways / none |
| SMA20 / SMA50 | 43.40 / 41.17 |
| RSI (14) / Stochastic %K | 56.5 / 61.9 |
| Bollinger %B / ATR | -4% / 0.73 |
| Support / Resistance 20 days | 42.47 / 44.95 |
| Data as of | 7 Agustus 2026 08:00 WIB |


