AIA Stock Technicals Today: Drops 2.48%, Testing Support Level
On Agustus 13, 2026: price 72.65 HKD, trend sideways, RSI 37.8, support 72.85, resistance 79.65. technical analysis of aia stock. AIA Stock Technicals — full…

AIA Group closed at HKD 72.65, down 2.48% from the previous close of 74.50, and the move matters less for the size of the drop than for where it leaves the stock: below the 20-day average at 76.80, below the 50-day average at 75.22, and sitting just under the Bollinger lower band at 72.96. That combination shows a market that is no longer simply drifting sideways, but is now testing the lower edge of its recent range. The chart suggests sellers have regained control in the short term, even though the broader trend still reads as sideways rather than decisively downward.
Trend & Price Action
As shown in the chart, the stock’s structure is weakening at the margin. The 20-day moving average is 76.80 and the 50-day moving average is 75.22, with price below both, which tells readers that recent trading has slipped under the levels that typically act as short- and medium-term reference points. There is no new moving-average crossover, so this is not yet a classic trend-break signal; instead, it is a softer warning that the shares are spending more time beneath their own recent mean. The SMA20 slope of 0.47% over 5 days still points to a sideways base rather than a clean downtrend, but the current price action is leaning against that base.
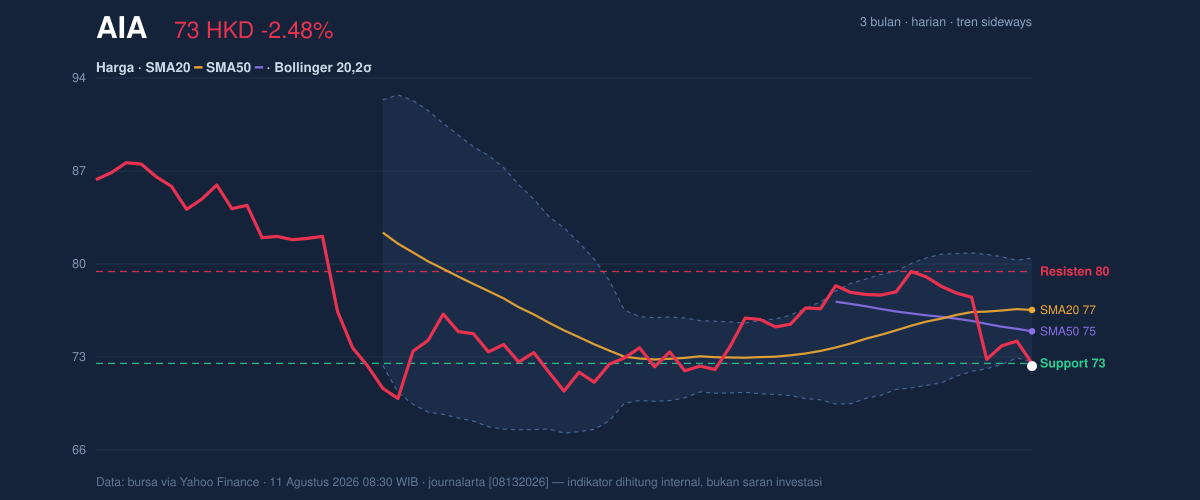
The stock is also near the lower end of its recent trading band. 20-day support at 72.85 is essentially being tested, while 20-day resistance at 79.65 remains well overhead. That places the last price at roughly the bottom of the range, only 3% from the support zone and far from the upper boundary. In practical terms, the market is saying that buyers have not yet been able to defend the average cost area with conviction. The broader 3-month range of 69.05 to 89.00 shows there is still room below if the floor gives way, but also room above if the stock can reclaim its moving averages and stabilise.
Oscillators & Momentum
The momentum picture is mixed, but the balance is still negative. RSI at 37.8 is not oversold, yet it is weak enough to show limited buying pressure. That matters because RSI below the mid-40s often signals that rebounds are possible, but they are not usually backed by strong trend confirmation. The Stochastic %K at 23.6 and %D at 33.9 suggests the stock is near the lower end of its recent momentum cycle, but not in a deep oversold condition. In plain language, the stock is tired, not exhausted.
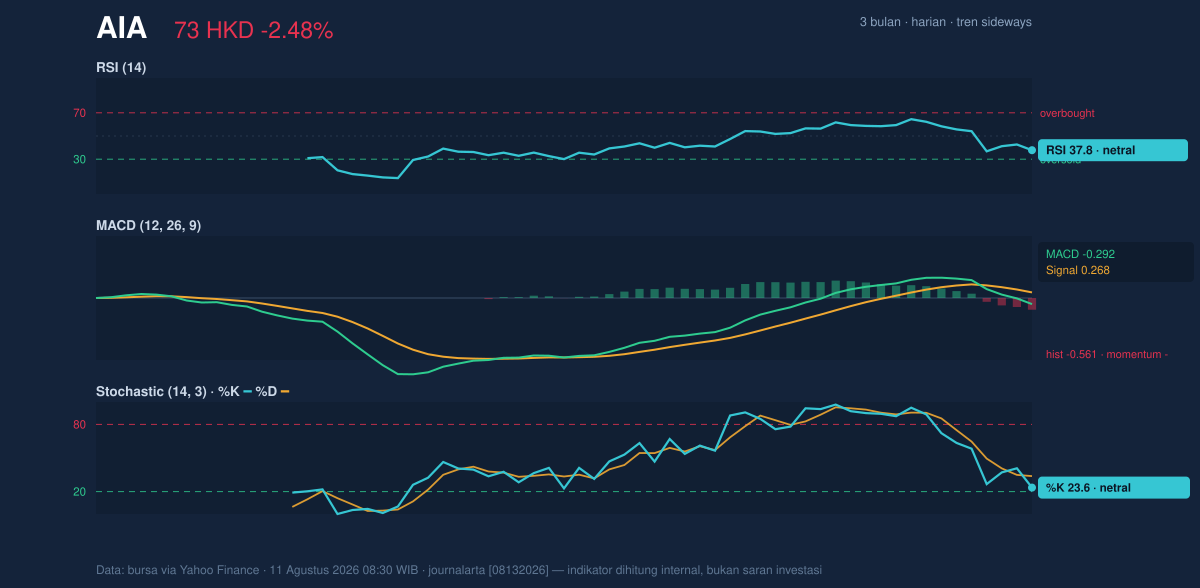
The more important signal is the MACD at -0.292, with the signal line at 0.268 and a histogram of -0.561. That spread means short-term momentum is running below its own trend gauge, which is a bearish setup even while the broader trend remains sideways. This is the kind of reading that often appears before either a deeper drift lower or a stabilisation phase, depending on whether price can recover the averages. For now, the MACD is telling readers that upside attempts are not yet strong enough to reverse the recent slide.
Volatility & Volume
Volatility is not spiking, but it is active enough to matter. ATR(14) at 2.13, or 2.9% of price, indicates moderate daily movement, which means the stock can still travel meaningfully within a session without needing a broad market shock. The Bollinger band width of 10.0% is described as normal, so this is not a compression setup that usually precedes a sharp break. Instead, the market is behaving in a fairly ordinary volatility regime, with the difference being that price is now pressing the lower band rather than floating near the middle.
Volume gives the latest decline more credibility. 32,086,579 shares changed hands versus a 20-day average of 27,348,281, or about 1.2 times normal. That is not a full-blown capitulation reading, but it does show participation on the sell side. The fact that OBV is falling reinforces the message: money flow has been leaving the stock rather than quietly accumulating it. When price weakens on above-average volume and OBV trends down, the move is usually more than random noise; it suggests distribution, or shares being sold into weakness.
Key Levels & Scenarios
The immediate line in the sand is 72.85 support. A clean hold above that level would keep the stock inside its recent range and leave room for a technical rebound toward the moving averages. If that support fails, the next reference is the lower edge of the broader 3-month range at 69.05, which becomes the more important downside marker. On the upside, 75.22 and 76.80 are the first recovery checkpoints because they mark the 50-day and 20-day averages. A move through those areas would not erase the recent weakness, but it would show the market is re-accepting the stock above its short-term cost basis.
The upper Bollinger band at 80.64 and 20-day resistance at 79.65 define the recovery ceiling for now. If price can retake that zone, the signal would shift from defensive to constructive. Until then, the chart remains fragile, with the burden on buyers to prove that the recent drop is only a test of support rather than the start of a deeper down-leg. The core message from the indicators is that AIA is still in a sideways framework, but it is trading on the weak side of that framework.
Technical Verdict: HOLD (wait & see)
- Entry Range: 72.85 to 75.22, where support and the 50-day average sit close together.
- Exit Target: 76.80 to 79.65, aligned with the 20-day average and 20-day resistance.
- Stop Loss protection: below 72.85, with the next downside reference at 69.05 if that level fails.
The setup is not bearish enough for a breakdown call, but it is not strong enough to confirm a recovery either. The verdict is invalidated if price breaks below 72.85, because that would mean the nearest support has failed. For non-traders, this means the stock is sitting at a make-or-break level rather than giving a clear direction.
Last price: HKD 72.65.
Summary Data AIA
| Last price | 72.65 HKD |
| Change 1 day / 5 days / 1 month | -2.48% / -6.92% / -1.96% |
| Trend / MA-cross | sideways / none |
| SMA20 / SMA50 | 76.80 / 75.22 |
| RSI (14) / Stochastic %K | 37.8 / 23.6 |
| Bollinger %B / ATR | -4% / 2.13 |
| Support / Resistance 20 days | 72.85 / 79.65 |
| Data as of | 11 Agustus 2026 08:30 WIB |


