Alibaba Stock Analysis: Drops 3.24%, Momentum Gains
On Agustus 13, 2026: price 122.60 HKD, trend uptrend, RSI 64.1, support 110.00, resistance 128.10. technical analysis of alibaba stock.

Alibaba Group’s Hong Kong-listed shares fell to HKD 122.60 in early trading on 11 August 2026, after a 3.24% one-day drop from the previous close of HKD 126.70, even as the stock remains in an established uptrend on the daily chart. The move matters because it shows a market that is still structurally stronger than it was a month ago — the shares are up 10.65% over one month — but are now testing how much near-term momentum can be sustained after a fast run. The message from the chart is not that the trend has broken; it is that the stock is pausing inside a rising channel, with traders watching whether demand can absorb profit-taking around the upper end of the recent range.
Trend & Price Action
As shown in the chart, Alibaba is trading above SMA20 at HKD 118.05 and well above SMA50 at HKD 111.63, which keeps the medium-term structure pointed higher. The slope of SMA20, up 3.61% over five days, signals that the short-term trend is still rising rather than flattening out. In plain terms, the average price buyers have been willing to pay over the last 20 sessions is still climbing, which usually reflects active accumulation rather than a weak bounce.
The stock is also sitting around the 70% mark of its 20-hour range, with support at HKD 110.00 and resistance at HKD 128.10. That positioning is important: it says the market has already recovered a large part of the range, but has not yet cleared the ceiling where sellers have recently appeared. The 3-month range — HKD 88.65 to HKD 144.00 — shows there is still broad room above and below, but the immediate battle is between the recent breakout area and the next resistance band.
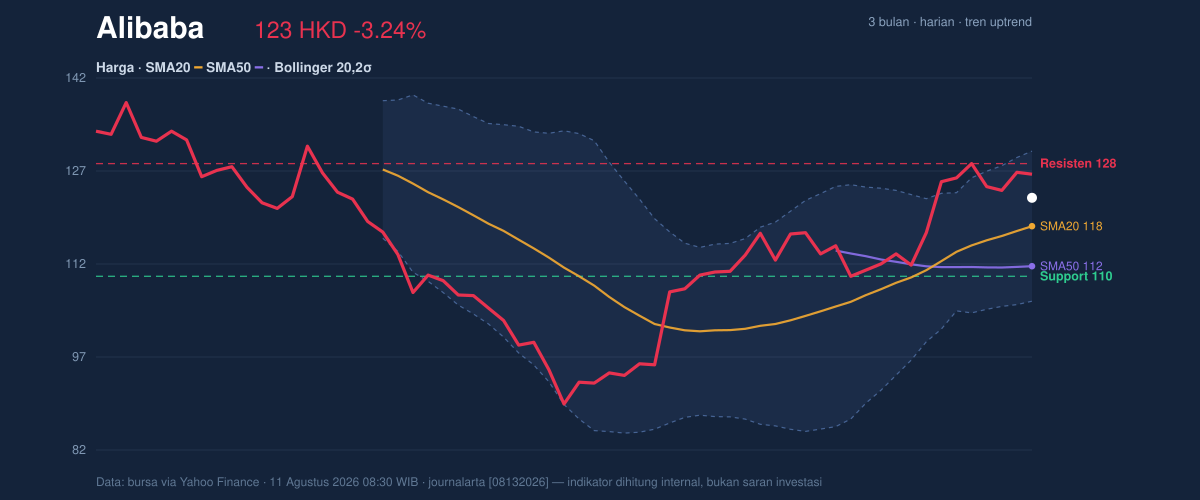
The chart is still constructive, but the latest pullback shows the stock is being asked to prove itself near resistance.
Oscillators & Momentum
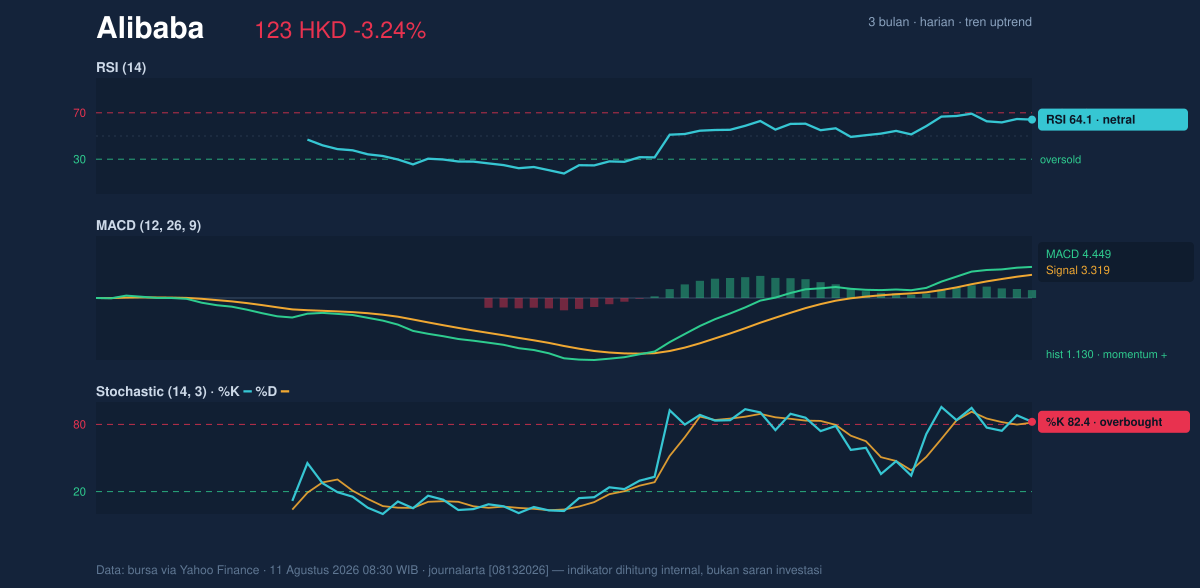
The momentum picture is mixed rather than outright bearish. RSI at 64.1 is still technically neutral, which means the stock is not yet in the kind of overheated zone that typically forces a reversal. But the Stochastic reading of 82.4 / 81.6 is in overbought territory, a sign that the recent advance has moved quickly enough that short-term traders may be locking in gains. In simple terms, RSI says the trend still has room; Stochastic says the pace may be getting stretched.
That tension is exactly why the momentum section matters. MACD at 4.449 above its signal line at 3.319, with a positive histogram of 1.130, still points to bullish momentum underneath the pullback. MACD is a trend-following tool: when it stays above the signal line, it usually means the larger directional move is still intact even if day-to-day price action gets choppy.
The signal is therefore not “trend over,” but “trend strong, short-term stretched.”
Volatility & Volume
Volatility has clearly expanded. The Bollinger Bands are wide, with the upper band at HKD 130.10, the middle band at HKD 118.05, and the lower band at HKD 106.00; the 20.4% band width confirms a more volatile tape. When bands widen, it usually means the market is expecting bigger swings, not a quiet drift. The current %B of 69% places the price in the upper half of the band, which is consistent with a stock that is still leaning upward, but not yet pressing into a fresh breakout.
The volume picture adds nuance. Last volume was 74,286,963, below the 20-session average of 100,347,580, or about 0.7× normal. That means the latest move did not come with full participation from the market. In technical terms, a rally or hold above resistance tends to be more convincing when volume expands; lighter turnover can mean buyers are present, but not yet committed enough to force a decisive move.
Still, OBV is rising, which suggests the broader flow of money has been moving in the right direction even if the latest session was quieter. That divergence is useful: it implies the stock’s base demand has been improving over time, but the immediate breakout test has not yet attracted the kind of volume that usually confirms a clean extension.
Key Levels & Scenarios
The main levels are straightforward. Support at HKD 118.05 aligns with the Bollinger middle band and SMA20, making it the first line the market will likely defend. Below that, HKD 110.00 is the next clear support and a more important “line in the sand” because it sits near the lower end of the recent range. On the upside, HKD 128.10 is the immediate resistance, and HKD 130.10 is the upper Bollinger band that often acts like a magnet and a ceiling at the same time.
If price can reclaim and hold above HKD 128.10, the chart would suggest the pullback was only a pause inside the uptrend, with the next technical test near the upper band at HKD 130.10. If it fails to hold HKD 118.05, the market would be signaling that short-term momentum is weakening and that a deeper retracement toward HKD 110.00 is becoming more plausible.
Technical Verdict: HOLD (wait & see)
HOLD (wait & see)
- MACD remains positive and above its signal line, which keeps the broader trend constructive.
- Price is above SMA20 and SMA50, so the medium-term structure is still upward.
- Stochastic is overbought and volume is only 0.7× normal, which argues for patience rather than chasing the move after a sharp daily decline.
Verdict invalidated if price falls below HKD 110.00.
- Ideal Entry Range: HKD 118.05 to 122.60
- Exit Target: HKD 128.10 to 130.10
- Stop Loss protection: below HKD 110.00
In plain English: the trend is still up, but the stock needs to prove it can hold its ground before the next leg higher.
Summary Data Alibaba
| Last price | 122.60 HKD |
| Change 1 day / 5 days / 1 month | -3.24% / -2.54% / 10.65% |
| Trend / MA-cross | uptrend / none |
| SMA20 / SMA50 | 118.05 / 111.63 |
| RSI (14) / Stochastic %K | 64.1 / 82.4 |
| Bollinger %B / ATR | 69% / 4.76 |
| Support / Resistance 20 days | 110.00 / 128.10 |
| Data as of | 11 Agustus 2026 08:30 WIB |


