BP Stock Analysis: Gains 1.16%, Momentum Weakens
On Agustus 13, 2026: price 530.70 GBp, trend sideways, RSI 55.4, support 507.70, resistance 555.90. technical analysis of bp stock. BP Stock Analysis — full…

BP plc is trading in a narrow mid-range on the London market, with the share price holding just above the 530p area while momentum remains mixed. The signal is not a breakout story yet; it is a test of whether the stock can defend its short-term base and rebuild strength from a neutral technical setup.
BP’s London-listed shares were last at 530.70 GBp, up 1.16% on the day after a 524.60 previous close, according to market data via Yahoo Finance. That places the stock almost exactly on its SMA20 at 530.91, which matters because it shows the market is still deciding whether this is a stable consolidation or a pause before another move. The longer-term backdrop is more constructive: SMA50 at 513.10 sits below the current price, so the medium-term trend has not broken down even though the short-term trend is only sideways.
Trend & Price Action
The key message from the chart is balance, not urgency. Price is slightly below the SMA20, but still above the SMA50, which usually means the stock is neither in a clear downtrend nor in a clean uptrend. The absence of a fresh MA-cross confirms that the moving averages have not produced a decisive directional signal.
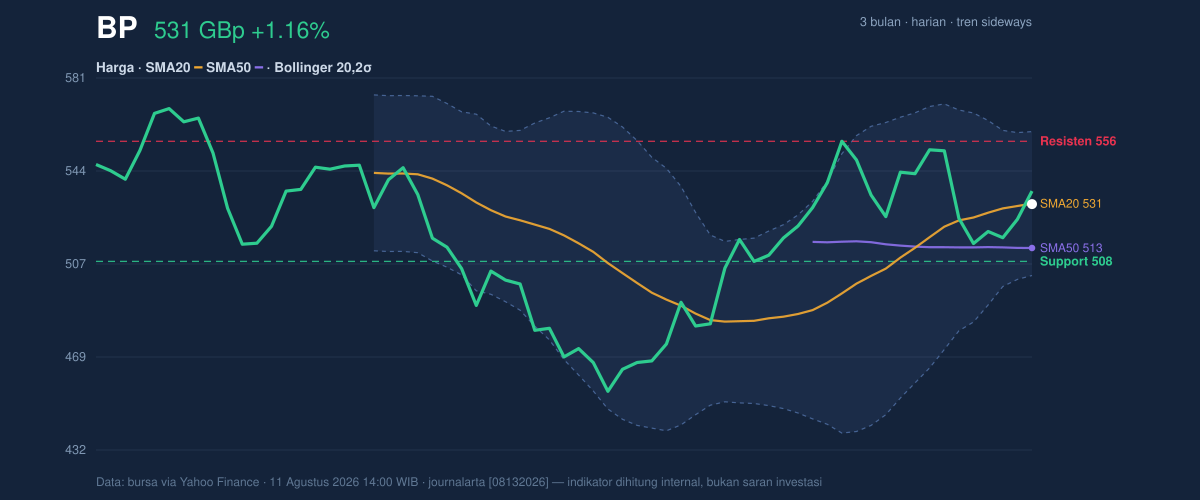
The Bollinger Bands reinforce that reading. With the upper band at 559.78, the middle band at 530.91 and the lower band at 502.03, BP is sitting at %B 50% — exactly halfway between the bands. In plain English, that means the share price is not stretched to the upside or downside. The 10.9% band width is described as normal, so there is no squeeze suggesting an imminent volatility break, and no expansion suggesting a strong trend has already started.
The stock is trading at 48% of its 20-hour range, with support at 507.70 and resistance at 555.90. That positioning is important: the market is closer to the middle of the range than either edge, which usually means traders are waiting for a catalyst rather than pricing one in.
Oscillators & Momentum
Momentum is less convincing than price action. RSI at 55.4 is neutral-to-firm, which tells readers the stock is not overbought and still has room to move, but it is not showing strong directional pressure either. Stochastic %K at 45.9 and %D at 25.9 also point to a neutral posture: the faster line is above the slower line, but not by enough to signal a strong bullish turn.
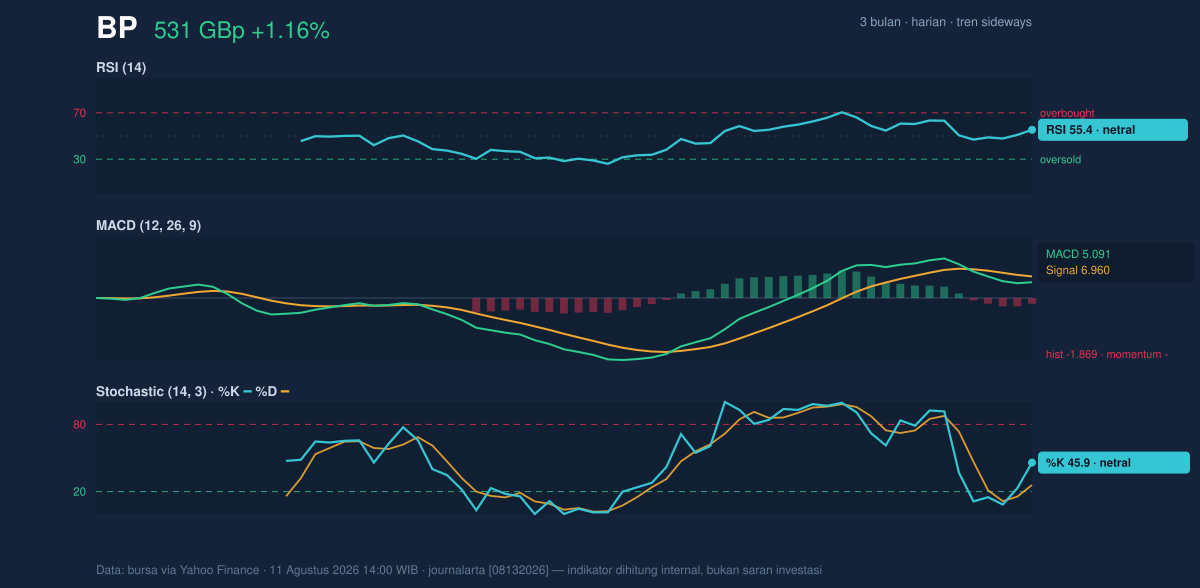
The more cautionary signal is from MACD. MACD at 5.091 is below the signal line at 6.960, leaving a -1.869 histogram. That negative histogram means short-term momentum is lagging the broader trend, even though the price has not broken down. In practical terms, BP can hold the range without momentum being strong, but it would need a fresh push in buying pressure to move beyond just stabilising.
Volatility & Volume
Volatility is present, but not extreme. ATR(14) at 16.53 equals about 3.1% of the share price, which suggests normal day-to-day movement rather than a disorderly market. That is useful because it means any move through support or resistance could be meaningful, but the stock is not currently behaving like a high-stress name.
Volume is not confirming a breakout. Last volume was 40,368,587, below the 20-hour average of 45,413,830, or 0.9× normal. Lower-than-average activity often signals hesitation: buyers are not yet showing enough conviction to force price out of the range. The OBV is down, which is a further warning sign because on-balance volume tracks whether volume is supporting price. A falling OBV while price is flat can mean rallies are not being backed by broad participation.
Key Levels & Scenarios
The market is boxed in between clearly defined levels. On the downside, 507.70 is the first level that matters because it marks the lower end of the 20-hour range and sits above the 3-month low of 450.60. If that support gives way, the chart would shift from neutral consolidation to a more defensive setup. On the upside, 555.90 is the near-term barrier to watch, just below the 3-month high of 575.70. A move through that zone would show that price is escaping the current sideways band and testing the upper part of the broader range.
The most important signal right now is that BP is trading between those boundaries without strong momentum confirmation. That means the next move is likely to be judged by whether price can stay above the middle band at 530.91 and reclaim the nearby resistance cluster, or whether it slips back toward 507.70 as volume stays soft.
Technical Verdict: HOLD (wait & see)
HOLD (wait & see)
- MACD remains negative with the histogram at -1.869, so short-term momentum is not yet aligned with the price holding above the medium-term average.
- RSI at 55.4 and Stochastic at 45.9/25.9 are neutral, which supports patience rather than conviction.
- Price is sitting near the SMA20 at 530.91 with normal Bollinger width, meaning the chart is balanced but not resolved.
- Verdict invalidated if price falls below 507.70.
- Ideal Entry Range: 507.70 to 530.91
- Exit Target: 555.90
- Stop Loss protection: below 502.03
For non-traders, this means BP’s chart is stable but not yet strong enough to call a decisive move. The next important test is whether the shares can hold above 507.70 and then challenge 555.90.
Summary Data BP
| Last price | 530.70 GBp |
| Change 1 day / 5 days / 1 month | 1.16% / 1.09% / 2.75% |
| Trend / MA-cross | sideways / none |
| SMA20 / SMA50 | 530.91 / 513.10 |
| RSI (14) / Stochastic %K | 55.4 / 45.9 |
| Bollinger %B / ATR | 50% / 16.53 |
| Support / Resistance 20 days | 507.70 / 555.90 |
| Data as of | 11 Agustus 2026 14:00 WIB |

