CSCO Testing Key Resistance: Stock Gains 2.86% (Agustus 13, 2026)
On Agustus 13, 2026: price 123.88 USD, trend sideways, RSI 63.2, support 109.66, resistance 123.88. technical analysis of csco stock. CSCO Testing Key…

Cisco Systems, Inc. rose to 123.88 USD on Nasdaq, up 2.86% from the previous close, and the move matters because it pushed the stock to the very top of its recent trading range, as shown by the exchange data and the chart. The advance is not just a one-day bounce. It comes after a 10.83% gain over one month, which suggests buyers have been willing to pay up for the shares, even as the broader pattern still reads as sideways rather than a clean uptrend.
Trend & Price Action
The stock is trading above the SMA20 at 116.20 and above the SMA50 at 118.01, which is a constructive sign because short- and medium-term averages are now below the market price. In plain language, that means recent buyers have regained control of the tape, even if the trend label remains sideways. The SMA20 slope of 0.93% over five days shows the short-term trend is tilting higher, but not yet with the kind of momentum that usually defines a decisive breakout.
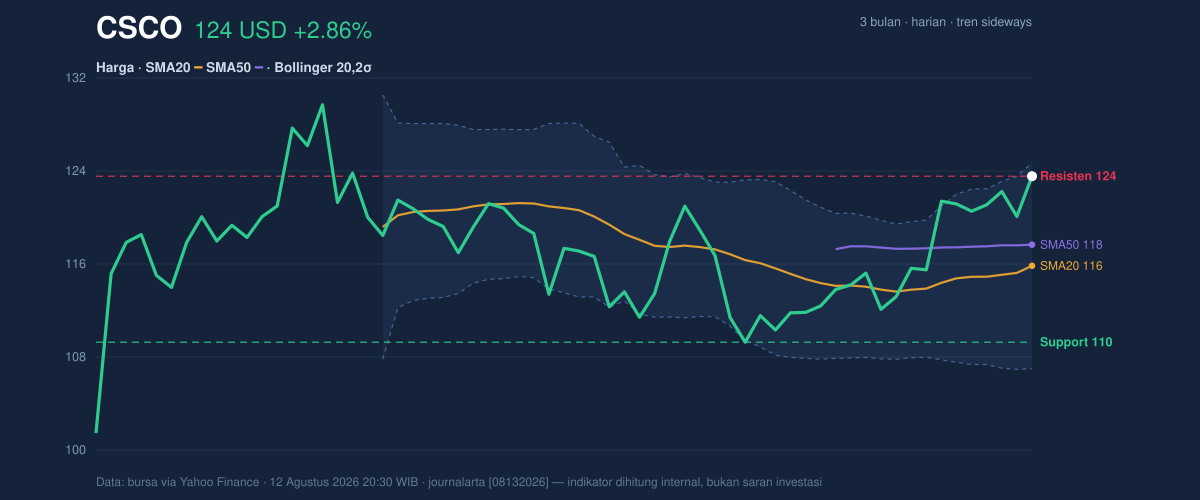
The price is also sitting at 100% of the 20-hour range, with support at 109.66 and resistance at 123.88. That position is important. When a stock closes at the top of its range, it often means the market is testing whether demand is strong enough to move into new territory, or whether recent buyers have already done most of the work. Cisco is now close to the Bollinger upper band at 125.02, which reinforces the same message: the stock is pressing against a short-term ceiling rather than resting near a bargain zone.
The broader three-month frame adds context. Cisco is below the 3-month high of 130.37 but well above the 3-month low of 99.29. That leaves the shares in the upper half of their recent range, which is consistent with recovery, but not yet with a fully established breakout.
Oscillators & Momentum
Momentum indicators are sending a mixed but useful signal. The RSI at 63.2 is still described as neutral, which means the stock is not yet in a classic overbought condition by itself. But the Stochastic %K at 93.6 and %D at 81.6 are clearly overbought, and that usually tells readers the stock has risen quickly relative to its recent history. In practical terms, it does not automatically mean the move is over. It does mean the pace of the advance may be getting stretched, and short pauses or pullbacks become more likely.
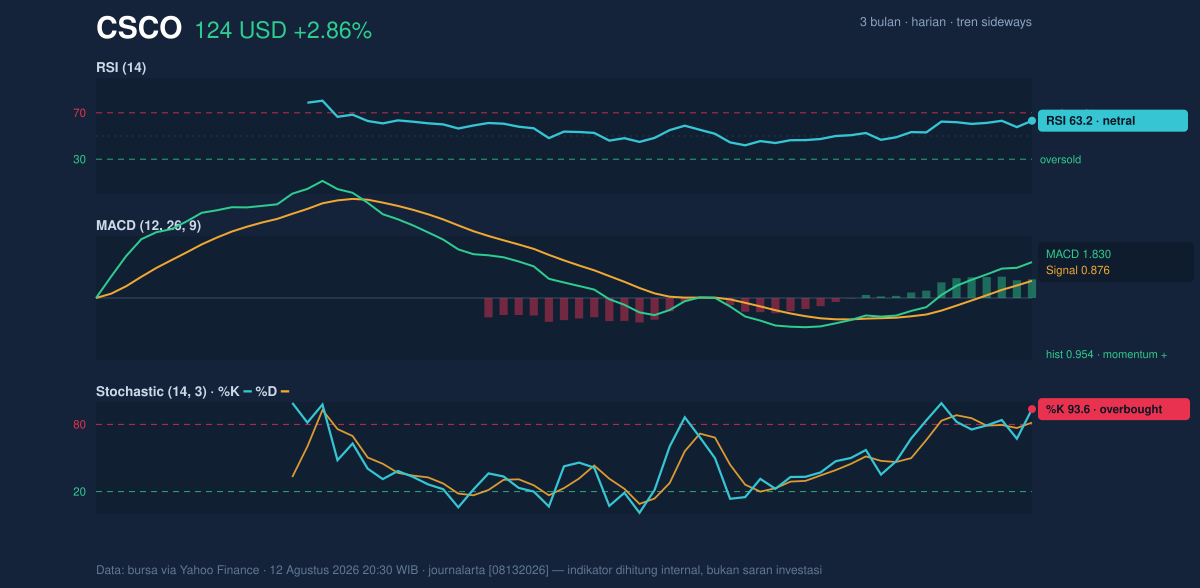
The MACD at 1.830 above its signal line at 0.876, with a histogram of 0.954, shows positive momentum remains intact. MACD is a trend-following tool, so when it stays above the signal line, it usually means the recent price trend is still stronger than the prior baseline. Put simply, Cisco has not lost upward traction yet. The tension is that this strength is now running alongside overbought stochastic readings, which often appears when a stock is climbing, but is also near a point where momentum can cool.
Volatility & Volume
Volatility is present, but not extreme. The ATR(14) at 3.94, equal to 3.2% of price, points to a stock that can still move meaningfully in either direction without being disorderly. The Bollinger Band width of 15.2% is described as normal, so this is not a squeeze that would usually hint at an imminent explosive move. Instead, the bands suggest a fairly standard environment in which price can continue drifting higher, but also has room to retrace if momentum fades.
Volume is the more notable confirmation. Trading volume of 35,752,300 was about 1.7× the 20-day average of 20,587,695, and OBV is rising. That combination matters because price gains backed by heavier participation tend to be more credible than thin, low-volume advances. In other words, the market is not just marking Cisco higher on light activity; there is evidence that more shares are changing hands as the stock pushes toward resistance.
Key Levels & Scenarios
The immediate technical map is clear. Resistance at 123.88 has already been tested, while the next visible overhead marker is the Bollinger upper band at 125.02. Above that, the 3-month high at 130.37 becomes the next reference point. On the downside, support at 109.66 is the first major floor, with the SMA20 at 116.20 and SMA50 at 118.01 acting as nearer trend supports.
If Cisco can hold above the current zone and continue to attract volume, the chart suggests the market is attempting to convert resistance into support. If it fails to hold the upper band area, the most likely first test would be whether the shares can stay above the moving averages, because that would show whether the recent rise was a true trend shift or just a stretched move inside a sideways pattern.
Technical Verdict: HOLD (wait & see)
HOLD (wait & see)
- MACD remains positive, so the underlying momentum still favors the upside.
- Volume is 1.7× the 20-day average and OBV is rising, which confirms participation behind the move.
- Stochastic is overbought and price is already at resistance 123.88 and near the upper Bollinger band at 125.02, so the short-term setup looks extended.
Verdict invalidated if price falls below 109.66.
- Ideal entry range: 116.20 to 118.01
- Exit target: 125.02 to 130.37
- Stop loss protection: 109.66
For non-traders, this means Cisco is technically strong, but it is already close to a short-term ceiling, so the chart is asking for confirmation rather than urgency.
Summary Data CSCO
| Last price | 123.88 USD |
| Change 1 day / 5 days / 1 month | 2.86% / 1.96% / 10.83% |
| Trend / MA-cross | sideways / none |
| SMA20 / SMA50 | 116.20 / 118.01 |
| RSI (14) / Stochastic %K | 63.2 / 93.6 |
| Bollinger %B / ATR | 94% / 3.94 |
| Support / Resistance 20 days | 109.66 / 123.88 |
| Data as of | 12 Agustus 2026 20:30 WIB |

