DBS Stock Drops 0.63%, RSI Overbought In Focus
On Agustus 13, 2026: price 75.85 SGD, trend uptrend, RSI 75.3, support 71.90, resistance 76.99. technical analysis of dbs stock. DBS Stock Drops — full details…

DBS Group’s shares slipped 0.63% to SGD 75.85 on 11 August 2026, easing from the previous close of SGD 76.33 even as the broader short-term trend remains constructive. The stock is still trading above its SMA20 at SGD 73.88 and well above its SMA50 at SGD 69.00, which tells the market that recent pullbacks have so far been treated more as pauses than as a change in direction. But the latest session also shows a more complicated message: price is pressing near the top of its recent range while momentum indicators are flashing caution, as shown in the chart.
Trend & Price Action
The structure remains upward. DBS is up 1.88% over five days and 7.15% over one month, with the SMA20 rising 1.88% over five days. That upward slope matters because it means the average short-term buyer is still paying more than they were a week ago, a sign of persistent demand rather than a one-off spike. The price is also sitting at 78% of its 20-day range, close to the upper end of the band between SGD 71.90 support and SGD 76.99 resistance. That positioning usually signals strength, but it also leaves less room for error if buyers hesitate.
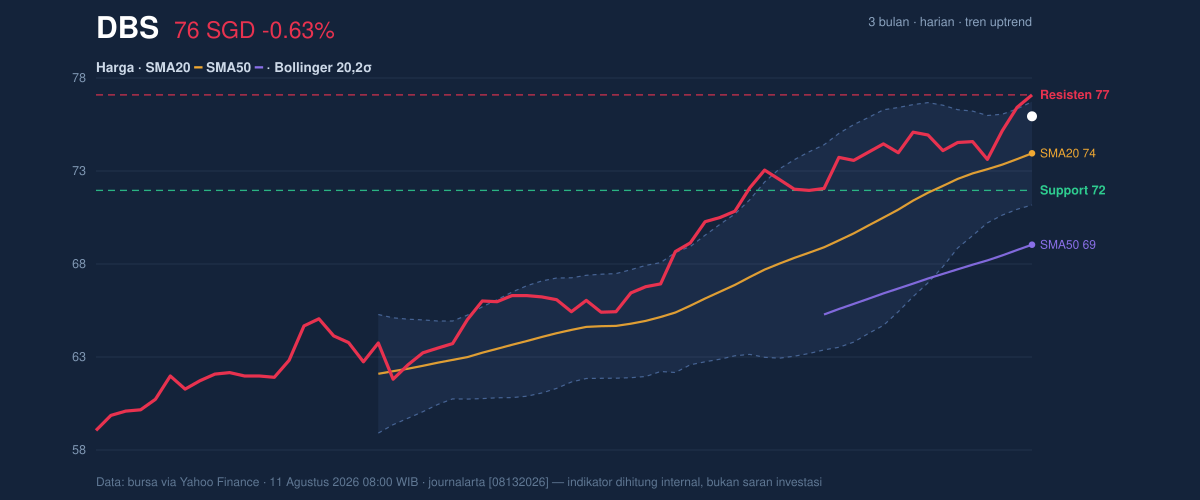
The Bollinger setup adds an important layer. The upper band is at SGD 76.63, and the stock is trading just below that level with %B at 86%. In plain English, DBS is near the upper edge of its recent volatility envelope, which often means the market is stretched rather than calmly balanced. The 7.5% Bollinger width is also narrowing, a squeeze that can precede a sharper move. A squeeze does not predict direction on its own; it simply says the stock is storing energy. In this case, that energy is being released while price is already near resistance, which raises the stakes for the next test of SGD 76.99.
One line stands out: the trend is still up, but the stock is no longer cheap in its own short-term range.
Oscillators & Momentum
Momentum is where the picture turns less comfortable. The RSI(14) at 75.3 is in overbought territory, meaning recent gains have been strong enough that buyers may be getting ahead of themselves in the near term. The Stochastic %K at 85.2 and %D at 89.6 are also overbought, reinforcing the same message: the stock has been running hot. Overbought does not automatically mean a reversal is imminent, but it often tells readers that the market is vulnerable to consolidation if fresh demand does not keep arriving.
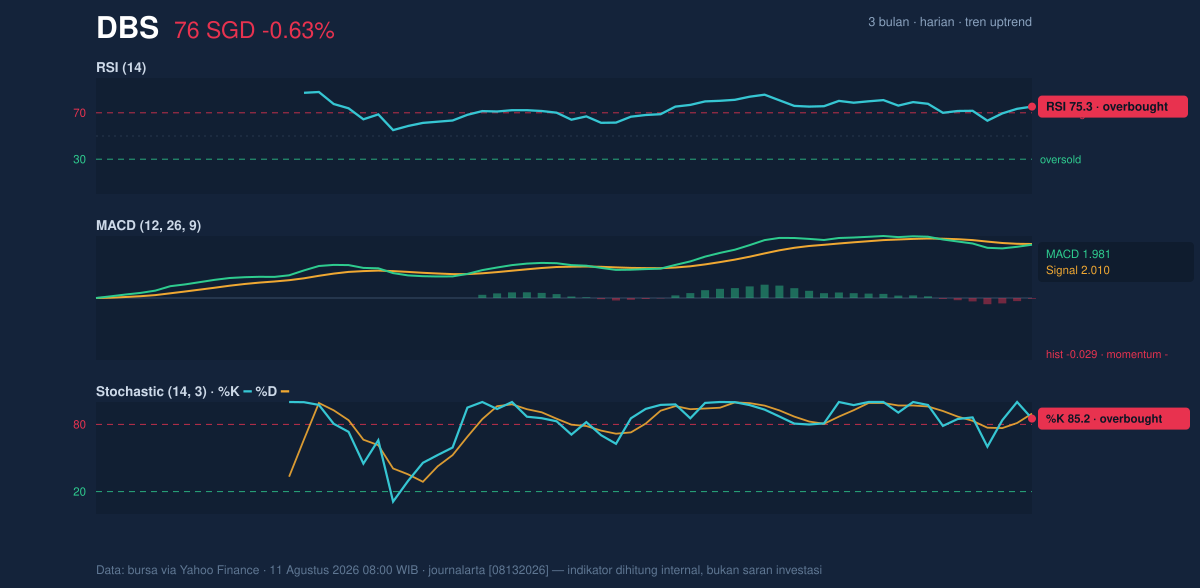
The MACD at 1.981 remains above zero, which is consistent with an underlying uptrend, but the signal line at 2.010 is now slightly higher and the histogram at -0.029 has turned negative. That small negative spread matters because it suggests the pace of upside is slowing even while the broader trend has not broken. In other words, the trend is still intact, but momentum is no longer accelerating. When RSI and Stochastic are overbought while MACD momentum softens, the market is often telling traders that the easy part of the move may already be behind it.
Volatility & Volume
Volume gives the move more credibility. Last session’s 8,213,600 shares traded were about 1.6× the 20-day average of 5,048,587, and OBV is rising. That combination usually means the latest price action is being supported by participation rather than drifting on thin turnover. For a large-cap bank like DBS, rising volume alongside an uptrend can signal institutional accumulation, or at least active interest at higher prices.
The ATR(14) of 1.30, equal to 1.7% of price, points to moderate volatility. That is important because it suggests the stock is not in a chaotic trading regime; instead, it has enough daily movement to test levels without implying disorder. Put together with the Bollinger squeeze, the message is straightforward: the market is compressed, active, and primed for a directional resolution. The question is whether that resolution comes through continuation above resistance or a cooling-off phase back toward the middle band at SGD 73.88.
Key Levels & Scenarios
The immediate battleground is clear. SGD 76.63 is the upper Bollinger band, and SGD 76.99 is the 20-day resistance. A clean push through that zone would suggest the market is absorbing overbought signals rather than being repelled by them. On the downside, SGD 73.88 is both the SMA20 and the Bollinger middle band, making it a key pivot for short-term trend health. Below that, SGD 71.90 support becomes the next level where buyers would be expected to reappear.
The 3-month high at SGD 77.97 is now close enough to matter. It is not just a number on a chart; it is the point where the market recently ran out of room, so any renewed strength above resistance would need to prove it can move beyond that ceiling rather than merely retest it.
Technical Verdict: HOLD (wait & see)
HOLD (wait & see)
- RSI at 75.3 and Stochastic at 85.2/89.6 show the stock is overbought, so upside may need a pause.
- MACD histogram at -0.029 shows momentum has softened even though the trend remains upward.
- Volume at 1.6× average and OBV rising mean participation is real, but price is already near SGD 76.63–76.99 resistance.
Verdict invalidated if price falls below SGD 73.88, which would mean the short-term trend is losing its footing.
- Ideal Entry Range: SGD 73.88 to SGD 71.90
- Exit Target: SGD 76.63 to SGD 77.97
- Stop Loss protection: below SGD 71.90
For non-traders, this means DBS still looks strong, but the stock is stretched enough that the next move matters more than the last one. “The market is at a point where it has to prove itself again.”
Summary Data DBS
| Last price | 75.85 SGD |
| Change 1 day / 5 days / 1 month | -0.63% / 1.88% / 7.15% |
| Trend / MA-cross | uptrend / none |
| SMA20 / SMA50 | 73.88 / 69.00 |
| RSI (14) / Stochastic %K | 75.3 / 85.2 |
| Bollinger %B / ATR | 86% / 1.30 |
| Support / Resistance 20 days | 71.90 / 76.99 |
| Data as of | 11 Agustus 2026 08:00 WIB |


