INTC Momentum Gains: Stock Gains 3.32% (Agustus 13, 2026)
On Agustus 13, 2026: price 100.95 USD, trend sideways, RSI 49.6, support 81.88, resistance 105.45. technical analysis of intc stock. INTC Momentum Gains — full…

Intel is trading higher, but the move sits inside a broader sideways structure, and that matters for international investors because the stock is still fighting the gap between short-term recovery and a weaker medium-term trend.
Intel (NASDAQ: INTC) finished at 100.95 USD on 12 August 2026, up 3.32% from the previous close of 97.71, according to Yahoo Finance data. That bounce looks meaningful on the day, yet the chart still shows a stock that has not escaped its wider range. Over the past month, the shares are down 1.98%, and the five-day move is nearly flat at -0.11%, which suggests the latest advance is more of a rebound than a clean trend change.
Trend & Price Action
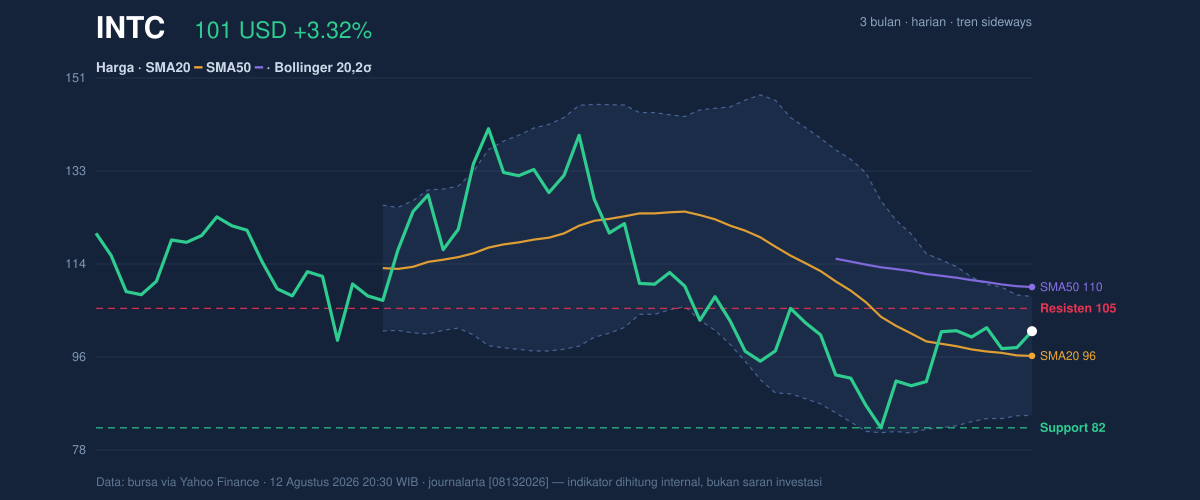
As shown in the chart, Intel is trading above its SMA20 at 96.07 but still below its SMA50 at 109.67. That positioning is important. Being above the 20-day average tells traders the stock has recovered enough to sit above its short-term baseline, but remaining below the 50-day average means the medium-term trend has not yet turned fully supportive. In plain terms, the stock has healed some of its recent weakness, but it has not yet proven that the broader down-slope is over.
The trend is described as sideways, with the SMA20 slope at -1.97% over five days. A falling short-term average usually signals that recent price action is still soft, even when the share price is temporarily above it. The lack of a fresh MA-cross also matters: there is no new moving-average crossover to confirm a stronger directional shift. That leaves the current move vulnerable to fading if buyers do not keep pressing.
The stock is also sitting near the upper half of its recent band. The 20-hour support stands at 81.88 and resistance at 105.45, while the price is at 81% of the range. That is a constructive location, because it shows Intel has moved away from the lower end of its recent trading zone. But it is also close enough to resistance that the next stretch higher may need fresh participation rather than just short-covering.
Oscillators & Momentum
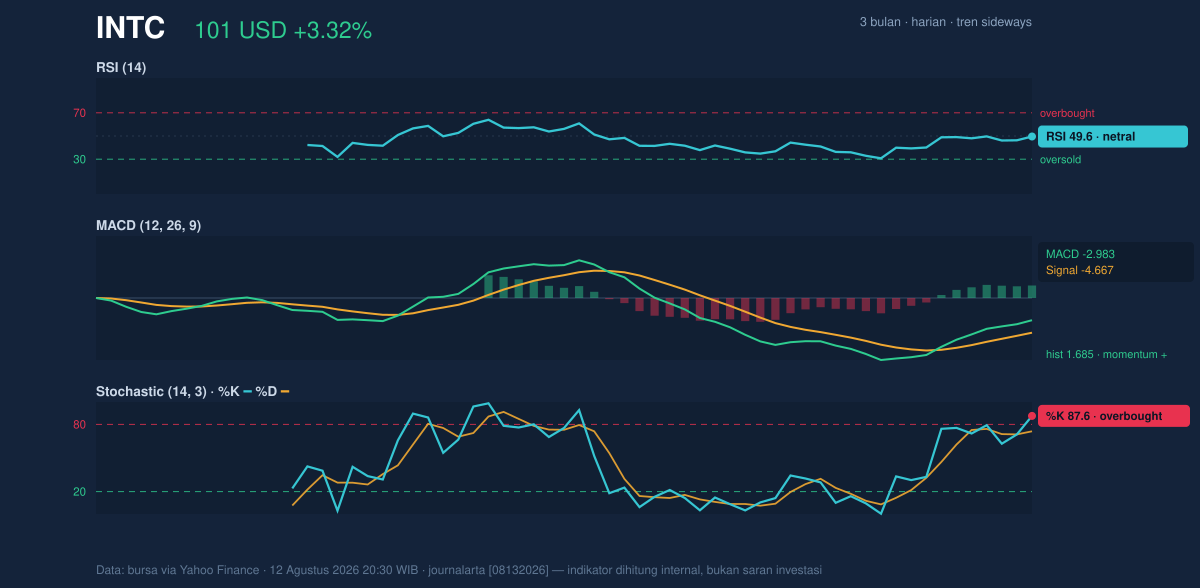
The momentum picture is mixed, and that mix is what gives the stock its current tension. The RSI at 49.6 is neutral, which means the market is neither overbought nor oversold on this measure. In simple terms, RSI is saying the stock is balanced, not stretched. That reduces the case for an immediate reversal, but it also does not confirm a strong breakout.
The Stochastic indicator is less comfortable. With %K at 87.6 and %D at 73.8, the stock is in overbought territory. Stochastic tends to react faster than RSI, so it often warns when a short-term bounce has run ahead of itself. Here, that does not automatically mean a drop is coming, but it does mean the stock may need to pause or digest gains before extending higher.
The MACD setup is the more encouraging part of the momentum story. Intel’s MACD is -2.983, above the signal line at -4.667, with a positive histogram of 1.685. That combination means downside momentum has eased and the shorter-term line has moved above the signal line, a classic sign that selling pressure is fading. Still, because both lines remain below zero, the stock is not yet in a fully bullish momentum regime. The chart is showing improvement, not confirmation.
Volatility & Volume
Volatility is elevated, and that changes how traders read the move. Bollinger Bands show the upper band at 107.80, the middle band at 96.07, and the lower band at 84.35. The bands are widening, with a width of 24.4%, which points to high volatility. Widening bands usually mean the market is preparing for a larger swing, not a quiet drift. When that happens, price can move sharply in either direction once it leaves the current balance zone.
The %B at 71% places Intel in the upper portion of the Bollinger envelope, closer to the top band than the middle. That supports the idea that the recent rally has room left, but it also shows the stock is no longer cheap on a short-term volatility basis. The ATR at 7.29, equal to 7.2% of price, reinforces that message. ATR measures average daily movement, and at this level it implies wide trading swings are normal right now.
Volume adds a bit of confirmation. The latest volume was 162,181,300, about 1.3x the 20-day average of 120,401,930, while OBV is rising. Rising OBV means volume has been supporting the move rather than quietly diverging from it. That is a healthier sign than a price rise on thin participation, especially when volatility is elevated.
Key Levels & Scenarios
The immediate ceiling is the 105.45 resistance area. That level matters because it sits just under the Bollinger upper band at 107.80, so a break above resistance would also push the stock closer to the top of its current volatility envelope. If Intel can clear that zone with volume, the chart would look more credible as a short-term continuation move.
On the downside, the key reference is 96.07, the SMA20 and Bollinger middle band. That is the line separating the current rebound from a return to weaker short-term structure. Below that, 84.35 is the lower Bollinger band, and 81.88 remains the 20-hour support. The 3-month low is 81.79, which shows the stock has already tested the lower end of its broader range and recovered from there.
If Intel holds above the middle band, the chart suggests the rebound can remain intact. If it slips back below it, the move starts to look more like a temporary spike inside a still-sideways pattern.
Technical Verdict: HOLD (wait & see)
HOLD (wait & see) — the stock is improving, but the indicators are not aligned strongly enough to call the move fully constructive.
- MACD is positive versus its signal line, which shows momentum has improved.
- RSI is neutral at 49.6, so the stock is not yet showing broad bullish strength.
- Stochastic is overbought and the trend remains below SMA50 at 109.67, which limits confirmation.
Verdict invalidated if price falls below 96.07, because that would mean Intel has lost its short-term trend support.
- Ideal Entry Range: 96.07 to 100.95
- Exit Target: 105.45 to 107.80
- Stop Loss Protection: 84.35, with 81.88 as the deeper support reference
For non-traders: Intel has bounced, but it still needs to prove that this is more than a short-lived recovery.
Summary Data INTC
| Last price | 100.95 USD |
| Change 1 day / 5 days / 1 month | 3.32% / -0.11% / -1.98% |
| Trend / MA-cross | sideways / none |
| SMA20 / SMA50 | 96.07 / 109.67 |
| RSI (14) / Stochastic %K | 49.6 / 87.6 |
| Bollinger %B / ATR | 71% / 7.29 |
| Support / Resistance 20 days | 81.88 / 105.45 |
| Data as of | 12 Agustus 2026 20:30 WIB |


