Momentum Weakens, AstraZeneca Stock Drops 2.40% Today
On Agustus 13, 2026: price 11,702.00 GBp, trend downtrend, RSI 37.6, support 11,500.00, resistance 13,134.00. technical analysis of astrazeneca stock.

As shown by 11,702.00 GBp on the LSE feed, AstraZeneca shares were trading below both short- and medium-term trend gauges on 11 August 2026, with the stock down 2.40% on the day and sitting well under its SMA20 at 12,394.50 and SMA50 at 13,141.68. That matters because price below both moving averages usually signals that sellers still control the tape, while the distance to the longer average shows the rebound has not yet rebuilt enough strength to challenge the broader trend.
Trend & Price Action
The chart shows a stock that is still leaning lower rather than stabilising. The downtrend is reinforced by the SMA20 slope of -2.28% over 5 days, which means the short-term average itself is falling, not just the share price. In technical terms, that is a sign of persistent pressure rather than a single weak session.
The absence of a fresh MA-cross also matters. A moving-average cross is one of the cleaner ways traders read trend change, and without a new bullish crossover, the chart has not produced a convincing reversal signal. Price is also only 12% of the way through the 11,500.00 to 13,134.00 range, which places it close to the lower end of that corridor and closer to support than resistance.
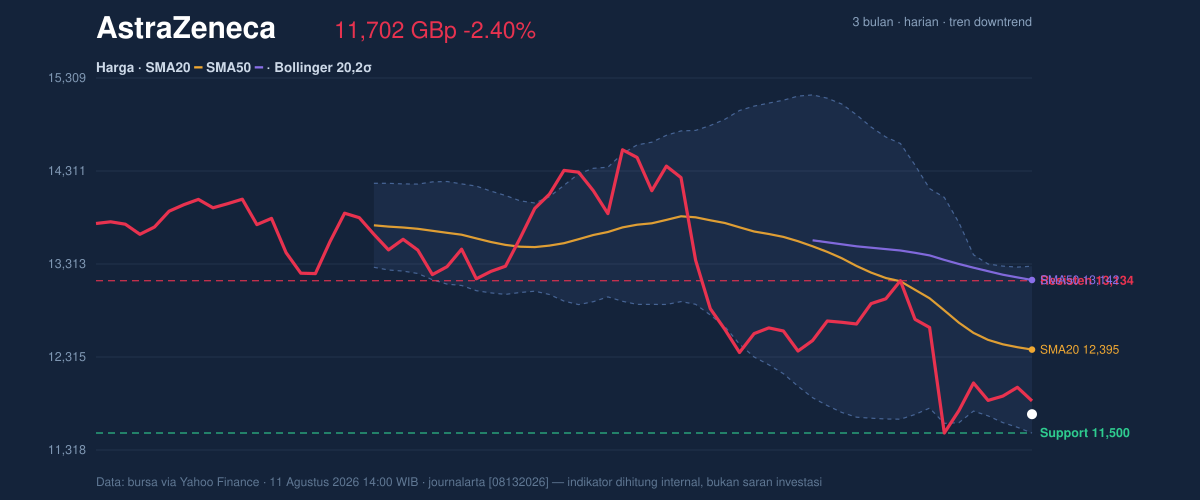
The broader context is not broken, but it is fragile. Over the past month the shares are down 5.35%, while the three-month range remains wide at 15,126.00 to 9,892.00. That tells readers two things: the stock has already absorbed a meaningful pullback, and there is still enough historical range below and above to allow further movement if support gives way or if buyers regain control.
Oscillators & Momentum
Momentum indicators are not yet confirming a reversal. RSI at 37.6 is technically neutral, but it sits closer to the lower end of the scale, which usually implies the stock is weak without being fully oversold. That is important because neutral RSI in a downtrend often means sellers have not exhausted themselves.
The Stochastic %K at 24.6 and %D at 36.5 are also labelled neutral, but the gap between the two lines suggests the near-term bounce attempt is not especially convincing. Stochastic is often used to spot turning points; here, it is more a sign of a stock drifting near the lower part of its recent range than one building a strong upside reversal.
MACD at -387.327, below its signal line at -350.510, with a histogram of -36.817, is the clearest negative read in the set. In plain English, MACD turning more negative than its signal line means downside momentum is still stronger than the trend is comfortable with. As shown in the momentum chart, the oscillators are not aligned with a bullish turn.
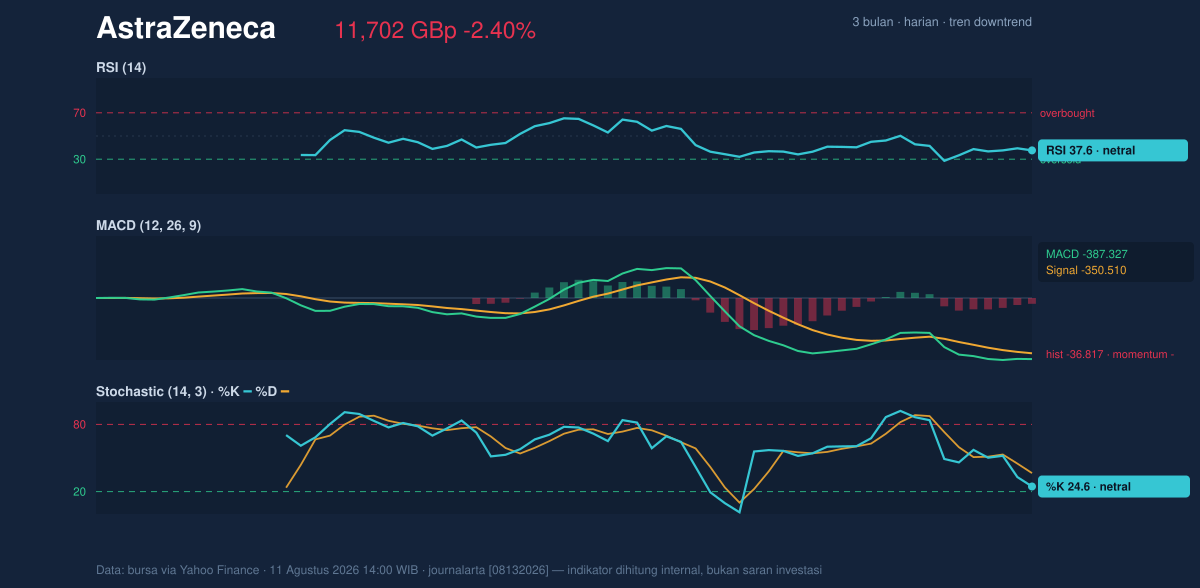
That said, the signal is not one-sided panic. The oscillators are weak, but not deeply washed out, which leaves room for either continued drift lower or a base-building phase if price can hold nearby support. The market is not flashing a capitulation signal; it is flashing caution.
Volatility & Volume
Volatility is present, but not extreme. The ATR(14) at 404.88, equal to about 3.5% of price, suggests a typical daily swing that is large enough to matter but not so large that the chart is in disorder. That matters because a stock with moderate ATR can still trend lower in an orderly way, and that is often harder to reverse than a panic sell-off.
Bollinger Bands add another useful layer. Price is below the middle band at 12,394.50 and only 11% up from the lower band at 11,499.06. In practical terms, that means the shares are trading near the lower edge of their recent volatility envelope. The 14.4% band width is normal, so this is not a squeeze that usually precedes a sudden breakout; it is a conventional range with a downside bias.
Volume offers a slight counterweight. Last volume of 2,713,440 was only about 0.6× the 20-day average of 4,271,060, which means the latest drop was not driven by unusually heavy participation. That can imply the sell-off lacks urgency, but it can also mean buyers are not yet stepping in decisively. The fact that OBV is rising is the most constructive volume clue here, since on-balance volume measures whether money flow is quietly improving even when price is still weak.
Key Levels & Scenarios
The nearest marker to watch is support at 11,500.00, which sits almost exactly on the lower Bollinger band at 11,499.06. When two technical levels cluster together like that, they tend to become more important, because traders see the same area as a potential floor. On the upside, resistance at 13,134.00 lines up closely with the SMA50 at 13,141.68, creating a second cluster that would need to be cleared before the chart could be read as healthier.
If the share price holds above 11,500.00 and starts to reclaim the 12,394.50 middle band, the chart would shift from defensive to neutral. If it fails to hold 11,500.00, the next signal would be that the lower part of the recent range has given way, opening the door to a deeper test of the broader 3-month low at 9,892.00.
Technical Verdict: HOLD (wait & see)
HOLD (wait & see) fits the chart best because the trend is still negative, but the stock is already near support and the volume picture is not confirming aggressive selling. The MACD remains below its signal line, the price is below SMA20 and SMA50, and the RSI/Stochastic pair is weak without being deeply oversold. At the same time, OBV rising and price sitting close to 11,500.00 argue against treating the move as a clean breakdown yet.
- Ideal Entry Range: 11,500.00 to 11,700.00, where support and the lower Bollinger band are clustered.
- Exit Target: 12,394.50 first, then 13,134.00 if momentum improves and price reclaims the middle band.
- Stop Loss protection: below 11,499.06, with the technical view invalidated if price breaks 11,500.00.
In plain English: the stock is weak, but the nearest floor has not been broken yet.
11,500.00 remains the key support level on the chart.
Summary Data AstraZeneca
| Last price | 11,702.00 GBp |
| Change 1 day / 5 days / 1 month | -2.40% / -0.32% / -5.35% |
| Trend / MA-cross | downtrend / none |
| SMA20 / SMA50 | 12,394.50 / 13,141.68 |
| RSI (14) / Stochastic %K | 37.6 / 24.6 |
| Bollinger %B / ATR | 11% / 404.88 |
| Support / Resistance 20 days | 11,500.00 / 13,134.00 |
| Data as of | 11 Agustus 2026 14:00 WIB |


