Momentum Weakens, HSBC Stock Drops 0.68% Today
On Agustus 13, 2026: price 161.40 HKD, trend sideways, RSI 56.6, support 155.30, resistance 168.20. technical analysis of hsbc stock. Momentum Weakens — full…

HSBC Holdings shares on HKEX slipped to 161.40 HKD by 11 August 2026 08:30 WIB, down 0.68% from the previous close at 162.50. The move leaves the stock almost exactly on its SMA20 at 161.48, a sign that the latest dip is not yet a clean breakdown, but it does show buyers have lost some immediate control. With the broader pattern still described as sideways, the chart is telling a simple story: the shares are consolidating rather than trending, and the next decisive move will likely come from whichever side of the current range gives way first.
Trend & Price Action
The medium-term structure remains constructive but not strongly directional. HSBC is still trading well above its SMA50 at 153.11, which means the longer trend has not been damaged, yet the fact that price is below the SMA20 shows short-term momentum has cooled. That combination usually signals a stock that has paused after a climb, rather than one that has fully reversed. The absence of a fresh MA-cross also matters: there is no new moving-average signal to force a stronger trend call, so the market is still waiting for confirmation.
The Bollinger Band position adds useful context. Price is sitting near the middle band at 161.48, with the upper band at 168.77 and the lower band at 154.20. A mid-band reading is often a sign of balance, not urgency. In plain terms, the stock is not stretched to the upside, but neither is it close to an oversold flush. The band width of 9.0% is normal, which suggests no major volatility squeeze is building a dramatic breakout on its own.
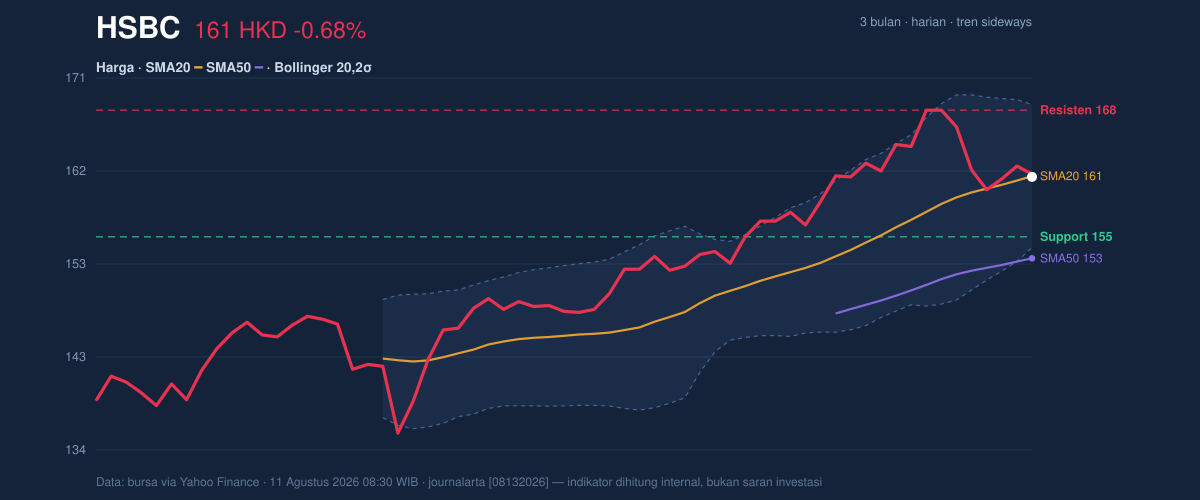
The strongest near-term message from the price structure is that HSBC is still holding inside a broad range. The stock is trading at 47% of the way through the 155.30 to 168.20 support-resistance corridor, which places it slightly below the midpoint. That positioning usually favors caution: the market has room to fall toward support, but not enough upward extension yet to call a clear breakout.
Oscillators & Momentum
Momentum indicators are mixed, and that mix is important. The RSI at 56.6 is neutral-to-firm, which means the stock is neither overbought nor oversold. That is a healthy reading in isolation, but it does not override the softer short-term price action. The Stochastic %K at 34.4 and %D at 38.8 also sit in neutral territory, leaning toward the lower half of the range without signaling a full oversold condition. In practical terms, this suggests the stock has cooled, but not enough to imply a panic selloff.
The more cautionary signal comes from MACD. The MACD at 2.832 remains above zero, but it is below the signal line at 3.581, and the histogram at -0.749 is negative. That setup means the trend is still positive on a broader basis, yet the latest impulse has weakened. Traders often read this as momentum losing pace before price fully reacts. It is not a bearish collapse signal, but it is a warning that the recent bounce may be tiring.
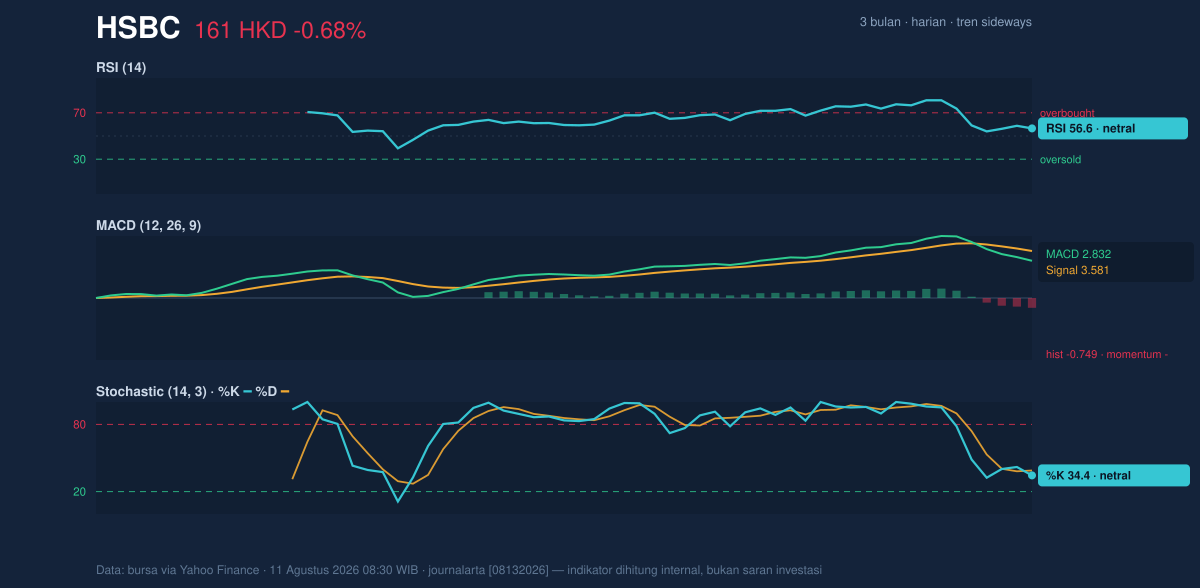
Put simply, the oscillators are not screaming reversal, but they are no longer confirming strength. That leaves HSBC in a “wait for proof” zone, where price must do more than hover around the moving average if it wants to reassert direction.
Volatility & Volume
Volatility is moderate. The ATR(14) at 3.11, or 1.9% of price, suggests daily swings are present but not extreme. That matters because a stock with moderate ATR can still move meaningfully, but it usually needs a catalyst or stronger participation to break out of range. The Bollinger width being normal reinforces that view: there is movement, but no compression signal that typically precedes a sharp expansion.
Volume is the bigger concern. The latest session recorded 9,756,226 shares, well below the 20-session average of 15,388,289, or about 0.6x normal. Thin participation often weakens the reliability of a price move because fewer market participants are committing to the direction. The falling OBV — on-balance volume, a measure that tracks whether volume is flowing into or out of a stock — adds to that caution. When OBV declines while price is still near the middle of the range, it usually means the balance of accumulation has softened.
That is why the current dip matters more than the headline percentage suggests.
Key Levels & Scenarios
The market is now leaning on a clear set of levels. Immediate support sits at 155.30, while resistance is defined at 168.20. The broader Bollinger frame places additional reference points at 154.20 on the downside and 168.77 on the upside. The stock’s 3-month high at 169.70 and 3-month low at 133.50 give the range more depth, showing the current consolidation is happening in the upper half of the recent trading band.
If HSBC holds above 155.30, the market can continue treating the move as a consolidation within the existing range. If it loses that level, the chart would begin to lean more defensively, with the lower Bollinger band at 154.20 becoming the next visible reference. On the upside, a move through 168.20 would put the stock back near the 168.77 upper band and the 169.70 three-month high, which is the area where sellers have historically shown up.
The key point is that HSBC is not breaking down, but it is also not showing enough volume or momentum to prove a fresh advance.
Technical Verdict: HOLD (wait & see)
HOLD (wait & see)
- MACD is still positive in absolute terms, but the negative histogram and MACD below signal show momentum is fading.
- Price is below the SMA20 and sitting near the middle Bollinger band, which signals balance rather than confirmed upside follow-through.
- Volume is only 0.6x normal and OBV is down, so the latest move lacks participation.
Verdict invalidated if price breaks and holds below 155.30.
- Ideal Entry Range: 155.30 to 161.48
- Exit Target (Target Price): 168.20 to 168.77
- Stop Loss protection: below 154.20
For non-traders, this means the stock is still in a holding pattern and needs stronger confirmation before the chart points clearly in one direction.
Summary Data HSBC
| Last price | 161.40 HKD |
| Change 1 day / 5 days / 1 month | -0.68% / -3.06% / 5.77% |
| Trend / MA-cross | sideways / none |
| SMA20 / SMA50 | 161.48 / 153.11 |
| RSI (14) / Stochastic %K | 56.6 / 34.4 |
| Bollinger %B / ATR | 49% / 3.11 |
| Support / Resistance 20 days | 155.30 / 168.20 |
| Data as of | 11 Agustus 2026 08:30 WIB |


