Momentum Weakens, HSBC Stock Gains 0.75% Today
On Agustus 13, 2026: price 1,537.80 GBp, trend uptrend, RSI 52.6, support 1,479.80, resistance 1,597.40. technical analysis of hsbc stock.

1,537.80 GBp is where HSBC Holdings sits after a 0.75% daily gain, but the more important signal is that the shares remain above the SMA20 at 1,534.04 while still trading well below the 20-day resistance at 1,597.40. That combination says the stock is holding its short-term uptrend, but it has not yet proved it can extend the move into a stronger breakout. As shown in the chart, price is mid-range rather than stretched, which usually means the next decisive move will depend on whether buyers can keep defending the recent trend line around the moving average.
Trend & Price Action
The technical backdrop is constructive, but not emphatic. HSBC is in an uptrend, and the SMA20 is rising by 0.92% over 5 days, which matters because a rising short-term average often reflects steady demand rather than a one-day burst. The share price is also above the SMA50 at 1,464.29, so the medium-term structure still leans higher. At the same time, there is no fresh MA-cross, meaning the chart is not currently flashing a new trend acceleration signal. Instead, it is showing a mature advance that is holding ground. The price sits at 49% of the 20-day range, which is a neutral position: not near the ceiling, not near the floor.
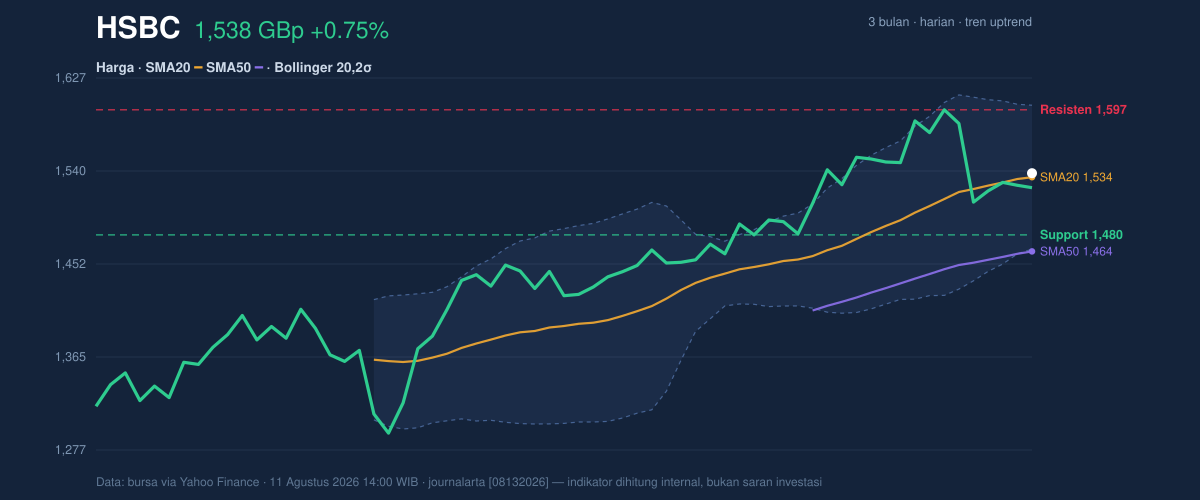
The wider context is equally important. HSBC is trading below the 3-month high of 1,610.00, but far above the 3-month low of 1,267.20. That gap shows the stock has already recovered a meaningful amount of ground, yet it has not entered the kind of extended overbought phase that often precedes a sharp pullback. Put simply, the trend is still alive, but it needs fresh momentum to move from “holding up” to “pushing higher.”
Oscillators & Momentum
The oscillators are telling a more cautious story. The RSI at 52.6 is neutral, which means the stock is neither overbought nor oversold. In plain language, that usually signals balance: buyers and sellers are roughly in equilibrium. The Stochastic reading of 36.5 / 38.3 is also neutral, but it sits closer to the lower half of the range, suggesting the recent advance has not yet built strong upside pressure. The more important warning comes from MACD: MACD 20.112 is below the signal line at 28.424, with a histogram of -8.312. That negative spread means the shorter-term pace of price movement has weakened relative to the longer-term trend, even while price itself remains above key averages.
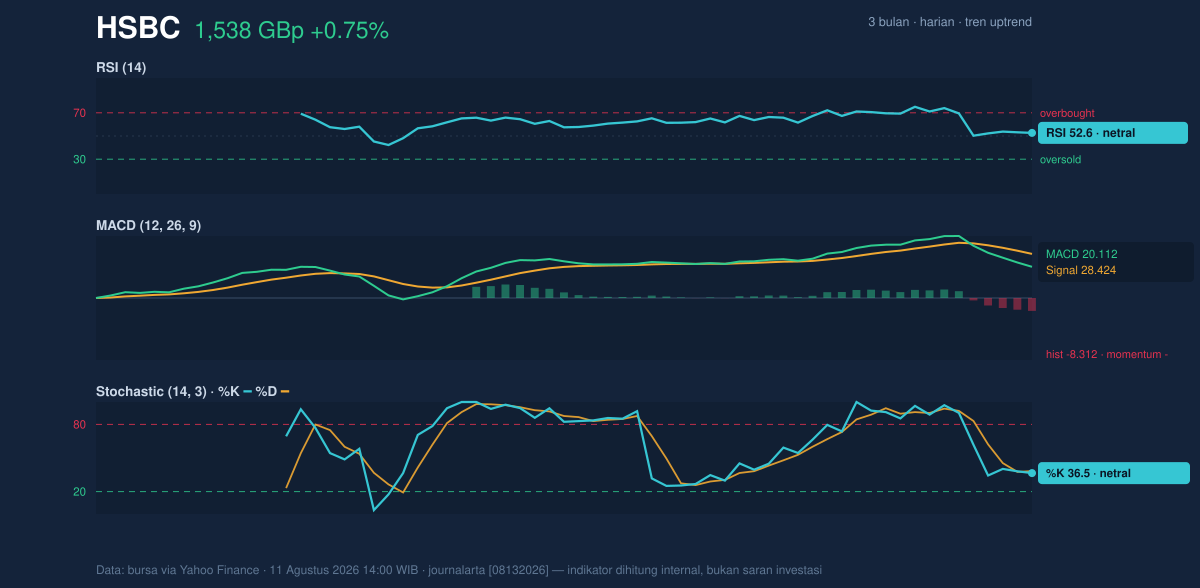
This is the sort of setup that often produces hesitation before direction becomes clearer. In other words, HSBC is not showing a bearish momentum collapse, but it is also not showing the kind of oscillator alignment that usually accompanies a clean breakout. The chart is asking a simple question: can price recover enough internal strength to match the still-positive trend structure?
Volatility & Volume
Volatility is moderate rather than explosive. The ATR(14) at 35.77 equals 2.3% of price, which suggests the stock can move, but not in a disorderly way. The Bollinger Band width of 8.8% is normal, so there is no compression signal pointing to an imminent squeeze, and no expansion signal suggesting a panic move is already underway. Price at a %B of 53% sits just above the middle band at 1,534.04, reinforcing the idea that HSBC is hovering near equilibrium rather than pressing hard in either direction.
Volume is the one area where the chart looks soft. Last volume was 10,466,879, only 0.4x the 20-day average of 26,193,725. That matters because price gains backed by weak participation are easier to fade. Still, the OBV is rising, which means cumulative buying pressure has been improving even if the latest session was quiet. The message is mixed: the market is not rejecting the move, but it is not yet showing broad conviction behind it either.
Key Levels & Scenarios
The immediate map is clear. Support at 1,479.80 is the first level that matters if the shares lose altitude, while resistance at 1,597.40 is the near-term ceiling to watch. The stock is currently in the middle of that band, so neither side has control. A move above resistance would open the way toward the 3-month high of 1,610.00, which is the next obvious reference point on the chart. If the share price slips back under the SMA20 at 1,534.04 and then weakens toward 1,479.80, the short-term bullish structure would start to lose credibility. As shown in the chart, the path forward is less about prediction and more about whether price can keep respecting the rising average.
Technical Verdict: HOLD (wait & see)
HOLD (wait & see) fits the current setup because the trend is still positive, but momentum has not fully confirmed it.
- Price above SMA20 and SMA50 keeps the broader structure constructive.
- MACD below signal with a negative histogram shows momentum is softer than the trend suggests.
- RSI and Stochastic are neutral, so the chart lacks a strong trigger in either direction.
Verdict invalidated if price falls below 1,479.80, because that would break the nearest support and weaken the current range structure.
- Ideal Entry Range: 1,534.04 to 1,479.80
- Exit Target (Target Price): 1,597.40, then 1,610.00
- Stop Loss protection: below 1,479.80
In plain English: HSBC is still holding its trend, but the chart wants proof before it can be treated as a stronger advance.
Next resistance: 1,597.40 GBp.
Summary Data HSBC
| Last price | 1,537.80 GBp |
| Change 1 day / 5 days / 1 month | 0.75% / -2.95% / 3.21% |
| Trend / MA-cross | uptrend / none |
| SMA20 / SMA50 | 1,534.04 / 1,464.29 |
| RSI (14) / Stochastic %K | 52.6 / 36.5 |
| Bollinger %B / ATR | 53% / 35.77 |
| Support / Resistance 20 days | 1,479.80 / 1,597.40 |
| Data as of | 11 Agustus 2026 14:00 WIB |


