MRK Stock Gains 1.92%, Testing Key Resistance In Focus
On Agustus 13, 2026: price 132.92 USD, trend uptrend, RSI 63.7, support 124.40, resistance 132.92. technical analysis of mrk stock. MRK Stock Gains — full…

Merck is pressing against the top of its recent trading band, a sign that the market is rewarding the stock’s steady uptrend even as momentum starts to look less decisive. The shares closed at 132.92 USD on the NYSE, up 1.92% on the day and 7.53% over one month, according to exchange-linked market data cited via Yahoo Finance.
The message in that move is straightforward: buyers are still in control, but the stock is now trading where good news has to keep arriving to justify further upside. Merck is sitting above both its short- and medium-term trend lines, yet it is also pressing into a zone where the latest gains may need fresh confirmation rather than simple continuation.
Trend & Price Action
Merck’s technical backdrop remains constructive. The shares are above the SMA20 at 129.15 and the SMA50 at 124.66, which tells traders the stock is trading above both its recent average price and its broader intermediate trend. In plain terms, that usually means pullbacks have been absorbed rather than extended into deeper selling.
The slope of the SMA20 is up 1.34% over 5 days, reinforcing that the short-term trend is still rising. There is no fresh MA-cross, so the current move is not being driven by a new crossover event; instead, it looks like continuation within an already established uptrend.
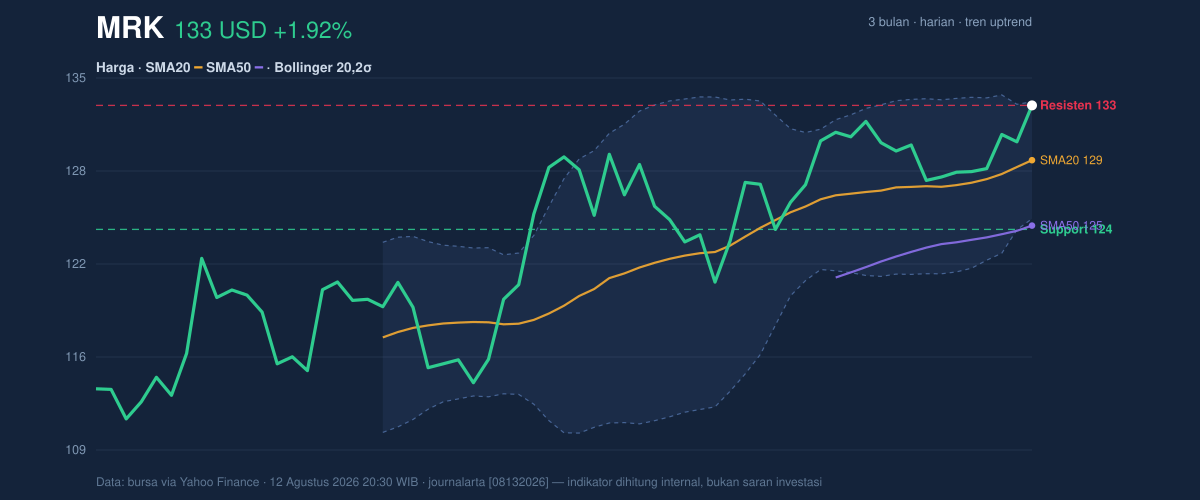
The more important nuance is where the shares are trading within their own range. The stock is at 100% of the 20-hour range, with resistance at 132.92 and support at 124.40. That matters because a stock at the top of its recent range is vulnerable to either a clean breakout or a pause. There is little room left for “cheap” entry on the chart itself.
A short, punchy read: Merck is strong, but it is no longer hidden in the lower half of the range.
Oscillators & Momentum
The momentum picture is less clean than the trend picture. RSI(14) at 63.7 is still described as neutral, but it is close enough to the upper end of the range to show the stock has been running hot without yet reaching a classic overbought extreme. That usually means there is still room for upside, but less tolerance for disappointment.
The Stochastic %K at 75.9 and %D at 58.9 point to firmer short-term momentum than RSI alone suggests, but not enough to call the move fully stretched. Stochastic tends to react faster than RSI, so its position near the upper band is a sign that price has been advancing faster than the broader trend measures may imply.
The caution flag comes from MACD. MACD at 1.673 sits just below the signal line at 1.683, leaving a histogram of -0.010. That tiny negative reading means the trend is still positive, but the pace of acceleration has softened. In practical terms, the stock is rising, yet the momentum engine is no longer pressing harder; it is idling just beneath the signal line.
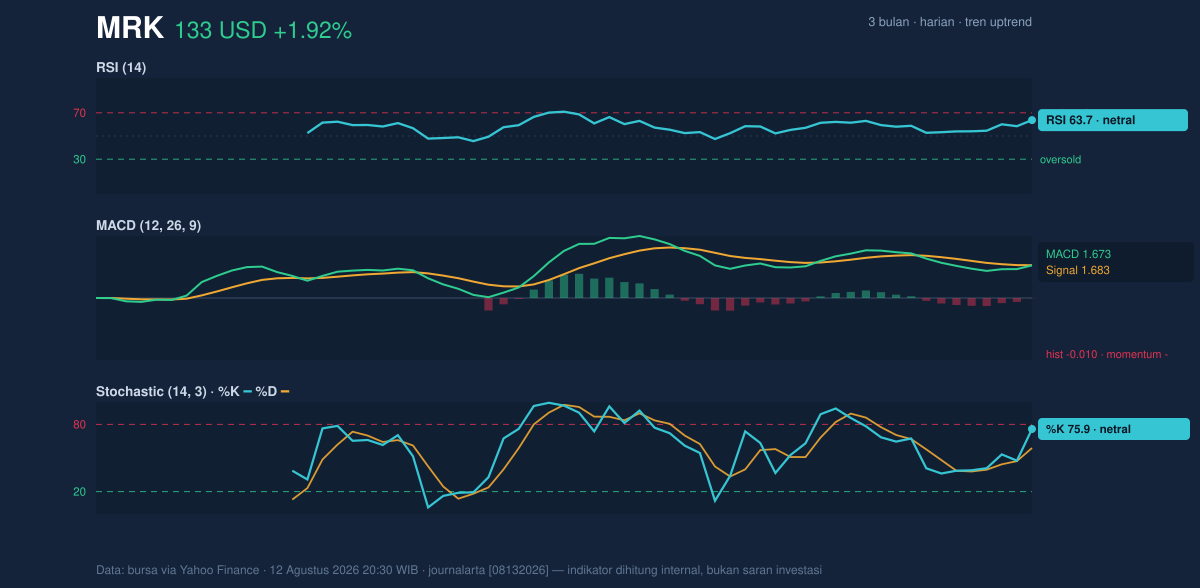
That combination — strong trend, softer MACD — often appears when a stock is consolidating near a peak rather than launching into a fresh surge.
Volatility & Volume
Bollinger Bands add another layer to the story. Merck’s %B at 97% means the price is trading very near the upper band, with the upper band at 133.17 and the middle band at 129.15. This is important because a stock that hugs the upper band is showing strength, but it can also become vulnerable to a brief reset if buyers pause.
The band width is only 6.2%, described as a squeeze. A squeeze means volatility has narrowed, which often precedes a larger move. The market is effectively coiling. The next move could be sharp, but the direction will depend on whether price can hold above the upper band or gets rejected from it.
Volatility itself is moderate: ATR(14) is 3.24, or 2.4% of price. ATR measures the average daily swing, so this reading suggests Merck is not behaving like a highly erratic name right now. That makes the upper-band test more meaningful: if a breakout comes, it may not be a disorderly spike, but a controlled extension.
Volume supports the move. Last volume was 10,171,700, above the 20-hour average of 8,736,805, or 1.2x normal, while OBV is rising. OBV, or on-balance volume, tracks whether volume is flowing into the stock on up days. A rising OBV alongside rising price usually confirms participation rather than a thin, low-conviction move.
In other words: the rally is being backed by real trading interest, not just price drift.
Key Levels & Scenarios
The chart’s immediate map is clear. 132.92 is the current resistance line and also the latest closing price, so the market is testing its own ceiling. Above that, the next reference from the data is the 3-month high at 135.05. On the downside, the nearest structural support is 129.15 at the SMA20, followed by 124.40 and then the 3-month low at 110.94.
If Merck can hold above 132.92 and keep volume firm, the chart would be signaling that the squeeze is resolving upward. If it fails there, the first place traders are likely to watch is the 129.15 area, where both the middle Bollinger band and SMA20 sit together. That confluence often acts like a magnet in a pullback.
The key point is not whether the stock is “good” or “bad”; it is whether the market can convert a stretched position near resistance into a sustained breakout.
Technical Verdict: HOLD (wait & see)
HOLD (wait & see)
- Trend is positive: price is above the SMA20 at 129.15 and SMA50 at 124.66, with the SMA20 slope still rising.
- Momentum is mixed: RSI at 63.7 and Stochastic at 75.9/58.9 show strength, but MACD histogram at -0.010 shows the upswing is losing a little force.
- Price is stretched near resistance: %B at 97% and the close at 132.92 place the stock at the top of its range, where confirmation matters more than enthusiasm.
Verdict invalidated if price falls below 129.15 and fails to reclaim that level, because that would weaken the short-term trend and the Bollinger midline support.
- Ideal entry range: 129.15 to 132.92, where the SMA20 and upper-range test can be monitored together.
- Exit target: 135.05, the 3-month high and next visible reference above current resistance.
- Stop loss protection: 124.40, the 20-hour support, with deeper trend damage below that zone.
For non-traders: Merck looks steady, but the chart is asking for proof that this push can continue before it makes a fresh move higher.
Summary Data MRK
| Last price | 132.92 USD |
| Change 1 day / 5 days / 1 month | 1.92% / 3.58% / 7.53% |
| Trend / MA-cross | uptrend / none |
| SMA20 / SMA50 | 129.15 / 124.66 |
| RSI (14) / Stochastic %K | 63.7 / 75.9 |
| Bollinger %B / ATR | 97% / 3.24 |
| Support / Resistance 20 days | 124.40 / 132.92 |
| Data as of | 12 Agustus 2026 20:30 WIB |

