NVDA Stock Gains 3.03%, Golden Cross Formed In Focus
On Agustus 13, 2026: price 224.09 USD, trend uptrend, RSI 62.1, support 190.01, resistance 224.09. technical analysis of nvda stock. NVDA Stock Gains — full…

Nvidia rose on the NASDAQ to 224.09 USD after a 3.03% one-day gain, keeping the stock in a short-term uptrend even as the chart now presses against the upper end of its recent range. The move matters because it is not just a one-session bounce: the price is holding above both short- and medium-term trend lines, while momentum signals are starting to look stretched.
Trend & Price Action
Nvidia’s structure remains constructive. The share price is trading above SMA20 at 208.38 and SMA50 at 206.26, and the golden cross — where the 20-day average moves above the 50-day average — signals that shorter-term buying pressure has overtaken the broader recent trend. The SMA20 slope of 1.47% over 5 days reinforces that the trend is still rising rather than flattening.
That said, the stock is no longer sitting in the middle of its range. As shown in the chart, Nvidia is at the top of the recent band, with 20-hour resistance at 224.09 and the 3-month high at 236.54 not far above. The market is effectively asking a simple question: can buyers keep paying up here, or is the stock running into a ceiling? The answer matters because when price reaches the top of its range, follow-through depends more on conviction than on trend alone.
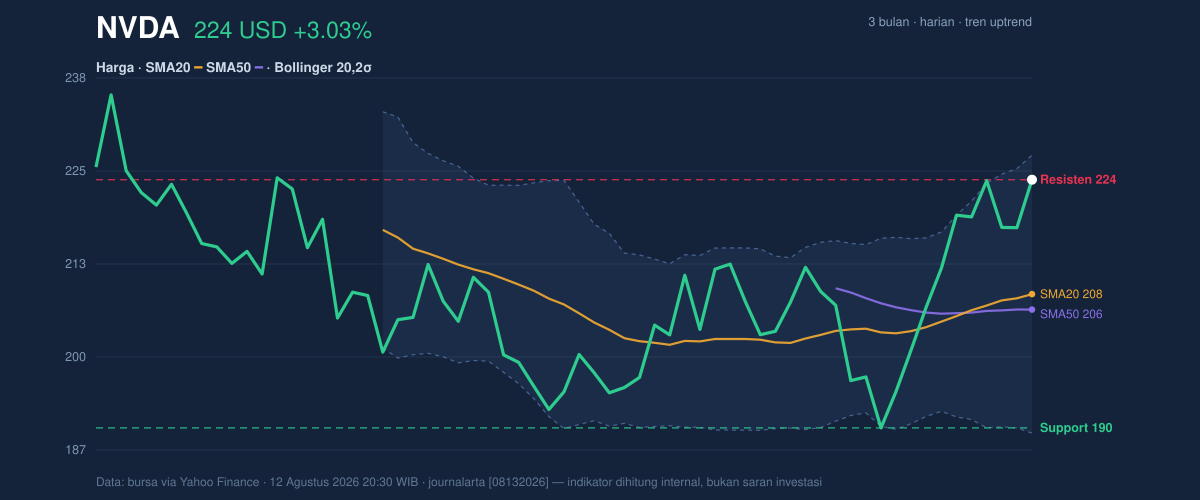
The Bollinger setup adds context. Price is near the upper band at 227.47, with %B at 91%, which means the stock is trading very close to the top of its 20-day volatility envelope. In plain language, that suggests the move has already consumed much of the normal upside room inside the band. The Bollinger width of 18.3% is still normal, so this is not a volatility squeeze that is likely to explode immediately; instead, it points to a market that is active but not unusually compressed.
Oscillators & Momentum
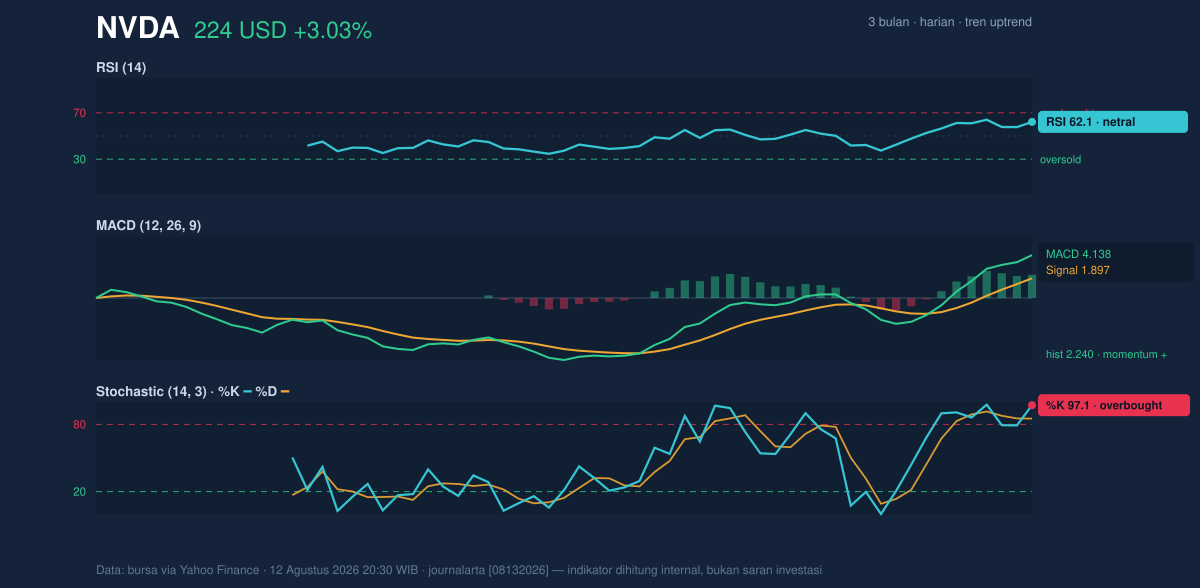
The momentum picture is mixed, and that is the key signal in this chart. RSI at 62.1 is still neutral, which means the stock is not yet in classic overbought territory on that measure. But the Stochastic %K at 97.1 and %D at 85.2 are clearly overbought, showing that the latest leg higher has moved quickly enough to leave the short-term oscillator stretched. In practical terms, Stochastic is warning that the stock may need to pause or consolidate even if the broader trend remains positive.
The MACD is more supportive. With MACD at 4.138, above the signal line at 1.897, and a histogram of 2.240, the chart still has positive trend momentum behind it. MACD is useful here because it shows that the medium-term move is still expanding, even if the fastest oscillators are overheated. As shown in the chart, the message is not that the trend has failed — it is that the trend is strong enough to have pushed short-term momentum into stretched territory.
Volatility & Volume
Volatility is moderate rather than extreme. The ATR(14) of 7.83, equal to about 3.5% of price, suggests Nvidia can still move meaningfully in either direction, but not in a disorderly way. That matters because a stock sitting near resistance with moderate ATR can either break out cleanly or stall and rotate lower; the indicator does not force a directional answer, but it does define the size of possible swings.
Volume is not confirming a euphoric breakout. The latest trade volume of 108,543,600 is below the 20-hour average of 124,977,490, or about 0.9x normal. That means the rise is happening without unusually heavy participation, which can weaken the case for an immediate extension beyond resistance. Still, OBV is rising, and that is important: on-balance volume measures whether trading pressure is accumulating over time, so a rising OBV suggests buyers have been steadily in control even if the latest session was not backed by a volume surge.
Key Levels & Scenarios
The most important support is 190.01, the 20-hour support level, which also sits close to the 3-month low of 189.80. That makes the 190 area a meaningful floor: if it gives way, it would imply the recent uptrend has lost its foundation and the stock could rotate back toward the lower part of its longer range. On the upside, 224.09 is now the immediate resistance-to-price pivot, while 227.47 marks the upper Bollinger band and 236.54 remains the broader 3-month high.
If Nvidia can hold above the 208.38 mid-band/SMA20 area after any pullback, the trend remains intact and the chart would still look like a healthy uptrend digesting gains. If it fails to hold 190.01, the current bullish structure would be materially weakened because the stock would be breaking below the support that has defined the recent range.
Technical Verdict: HOLD (wait & see)
HOLD (wait & see)
- Trend is bullish: price is above SMA20 at 208.38 and SMA50 at 206.26, with a golden cross confirming positive structure.
- Momentum is split: MACD is positive, but Stochastic is overbought and price is already near the upper Bollinger band at 227.47.
- Participation is decent but not emphatic: OBV is rising, yet volume is only 0.9x normal, so the latest push lacks strong breakout confirmation.
Verdict invalidated if price breaks below 190.01.
- Ideal Entry Range: 208.38–206.26
- Exit Target: 227.47–236.54
- Stop Loss protection: below 190.01
For non-traders, this means the stock still looks healthy, but it is close enough to resistance and overbought enough in the short term that patience matters more than chasing the move.
Summary Data NVDA
| Last price | 224.09 USD |
| Change 1 day / 5 days / 1 month | 3.03% / 2.22% / 5.45% |
| Trend / MA-cross | uptrend / golden |
| SMA20 / SMA50 | 208.38 / 206.26 |
| RSI (14) / Stochastic %K | 62.1 / 97.1 |
| Bollinger %B / ATR | 91% / 7.83 |
| Support / Resistance 20 days | 190.01 / 224.09 |
| Data as of | 12 Agustus 2026 20:30 WIB |


