OCBC Stock Gains 2.94%, RSI Overbought In Focus
On Agustus 13, 2026: price 31.19 SGD, trend uptrend, RSI 77.6, support 27.88, resistance 31.36. technical analysis of ocbc stock. OCBC Stock Gains — full…

OCBC Bank’s shares on SGX climbed to 31.19 SGD by 11 August 2026, extending a move that has already lifted the stock 2.94% in one day, 8.04% over five days and 13.50% in a month, according to Yahoo Finance data. The advance matters not just because it is fast, but because it has carried the price to the edge of its recent trading range, where momentum often gets tested by profit-taking or, if demand stays firm, by another leg higher.
Trend & Price Action
The chart shows a stock that is still in a clear uptrend, with the price above the SMA20 at 29.08 and the SMA50 at 26.56 sitting well below current levels. That gap tells us the medium-term trend has improved materially; the market is paying up for OCBC’s shares rather than waiting for pullbacks. The SMA20 slope of 2.28% over five days reinforces that the short-term trend is not just intact but accelerating.
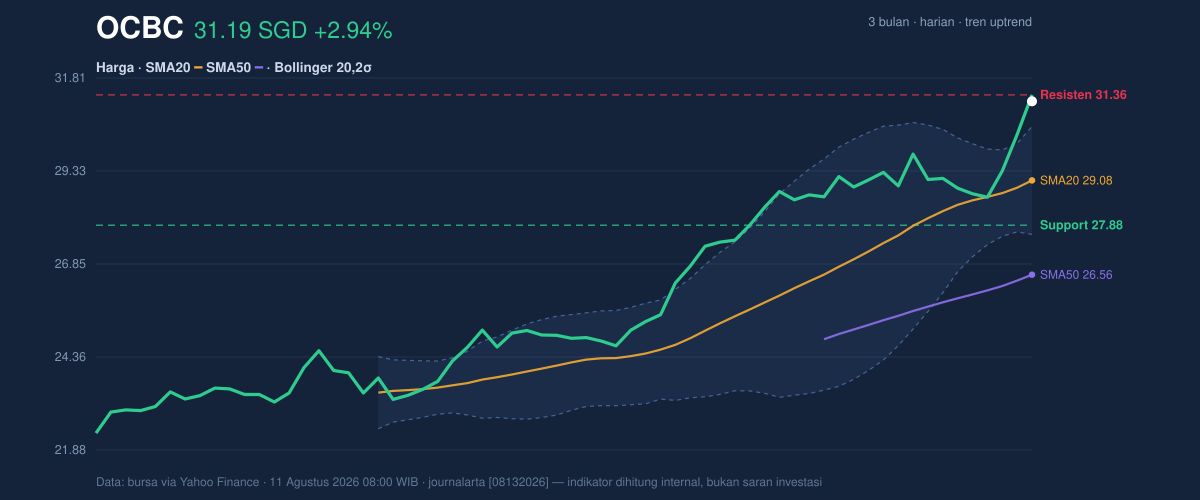
What stands out most is where the price now sits inside the range. The stock is trading near the top of its 3-month high of 31.56 and just under 20-hour resistance at 31.36, while the 20-hour support is 27.88. That positioning is important: a share price that is already at 95% of its recent range is no longer in discovery mode, but in a zone where the next move depends on whether buyers can absorb supply at the top. The fact that there is no new MA-cross suggests the trend is being driven by price strength rather than a fresh moving-average crossover signal.
The Bollinger Bands add another layer. With the upper band at 30.52, the stock is now trading above the band and the %B at 123% shows price has pushed beyond the typical upper envelope. In plain language, that usually means the move has become stretched relative to its recent average. It does not automatically signal reversal, but it does tell readers that the market is paying an unusually strong premium versus the last 20 sessions.
Oscillators & Momentum
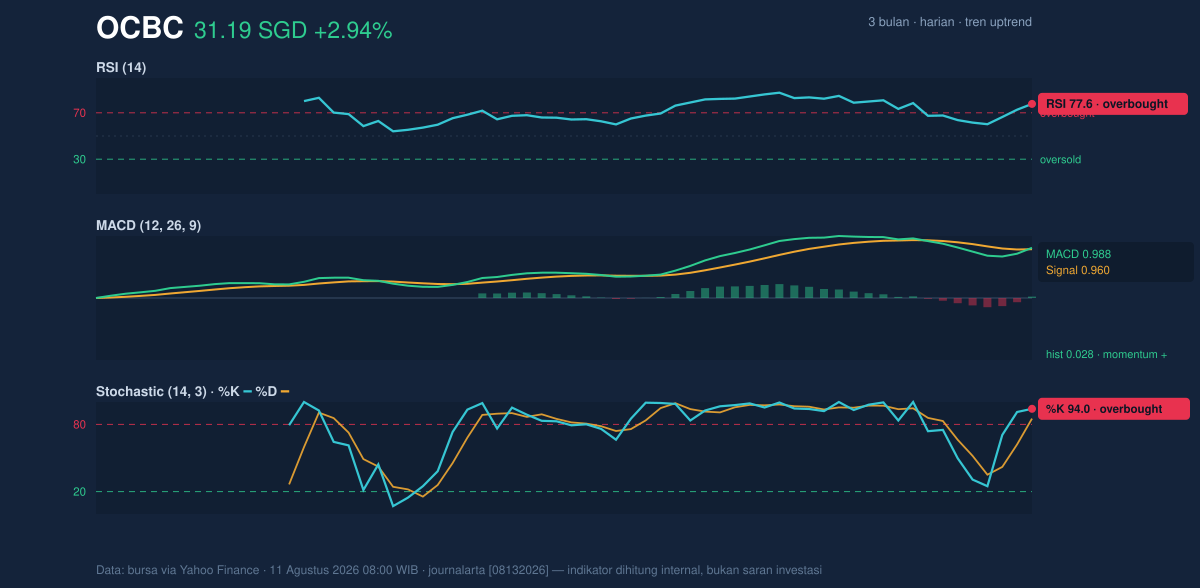
Momentum indicators are aligned with the trend, but they are also flashing caution. The RSI at 77.6 is in overbought territory, and the Stochastic %K at 94.0 with %D at 85.2 says the same thing in a more short-term way: the stock has been rising so quickly that it may be vulnerable to a pause. Overbought does not mean “must fall”; it means recent buying has been strong enough that follow-through becomes harder to sustain without fresh catalysts.
The MACD is still supportive. With MACD at 0.988 above the signal line at 0.960 and a positive histogram of 0.028, momentum remains on the bullish side. That matters because it shows the rally has not yet lost internal strength, even if it is getting extended. Put simply, oscillators are split between strength and strain: RSI and Stochastic say the move is hot, while MACD says the trend has not broken.
Volatility & Volume
Volatility is not especially wild, which is notable given the speed of the rise. The ATR at 0.68, equal to 2.2% of price, points to moderate daily movement rather than panic trading. The Bollinger band width of 9.9% is described as normal, so this is not a squeeze setup waiting for explosive expansion. Instead, the market is already moving in a fairly orderly, if extended, uptrend.
Volume confirms participation. The latest session’s 13,249,100 shares traded versus a 20-hour average of 7,265,010, a 1.8× jump. That is a meaningful signal because price gains on heavy volume are usually more credible than gains on thin trading. The OBV is rising, which means volume flow is supporting the advance rather than diverging against it. In technical terms, buyers are not just lifting the price; they are showing up in size.
Key Levels & Scenarios
The immediate battlefield is tight. 31.36 is the nearest resistance, and the 31.56 three-month high is the next obvious reference if that ceiling gives way. On the downside, 27.88 is the first support that matters, followed by the SMA20 at 29.08, which now acts as a dynamic support line because the stock is trading above it.
If the price can hold above 31.36, the chart would be confirming that the market is willing to accept OCBC at new highs. If it fails there, the more likely reaction would be a retreat toward the 29.08 area, where the short-term trend would be retested. A break below 27.88 would be more meaningful, because it would undercut the recent range and challenge the idea that the rally is still being supported by broad participation.
Technical Verdict: HOLD (wait & see)
HOLD (wait & see) is the clearest technical reading here because the trend is strong, but the stock is also stretched. The RSI at 77.6 and Stochastic at 94.0/85.2 show overbought conditions, while MACD remains positive and volume is 1.8× average, which argues against calling the move exhausted. The price above SMA20 and SMA50 keeps the broader structure constructive, but the price above the Bollinger upper band suggests near-term upside may need consolidation first.
- Ideal Entry Range: 29.08 to 27.88, where the SMA20 and near-term support can be tested
- Exit Target: 31.36, with 31.56 as the next technical reference if resistance is cleared
- Stop Loss protection: below 27.88, because that would break the current support structure
The verdict is invalidated if price falls below 27.88, as that would weaken the short-term uptrend and the recent volume-backed strength.
In plain English, OCBC still looks strong, but after a fast run and an overbought reading, the chart is asking for proof that buyers can keep paying up near the highs.
Summary Data OCBC
| Last price | 31.19 SGD |
| Change 1 day / 5 days / 1 month | 2.94% / 8.04% / 13.50% |
| Trend / MA-cross | uptrend / none |
| SMA20 / SMA50 | 29.08 / 26.56 |
| RSI (14) / Stochastic %K | 77.6 / 94.0 |
| Bollinger %B / ATR | 123% / 0.68 |
| Support / Resistance 20 days | 27.88 / 31.36 |
| Data as of | 11 Agustus 2026 08:00 WIB |


