ORCL Stock Gains 5.36% Today, Testing Key Resistance
On Agustus 13, 2026: price 153.28 USD, trend sideways, RSI 59.7, support 114.99, resistance 153.28. technical analysis of orcl stock. ORCL Stock Gains — full…

Oracle is trading with a sharp burst above its short-term average, but the move is now pressing into the top of its recent range, where momentum can either extend or exhaust.
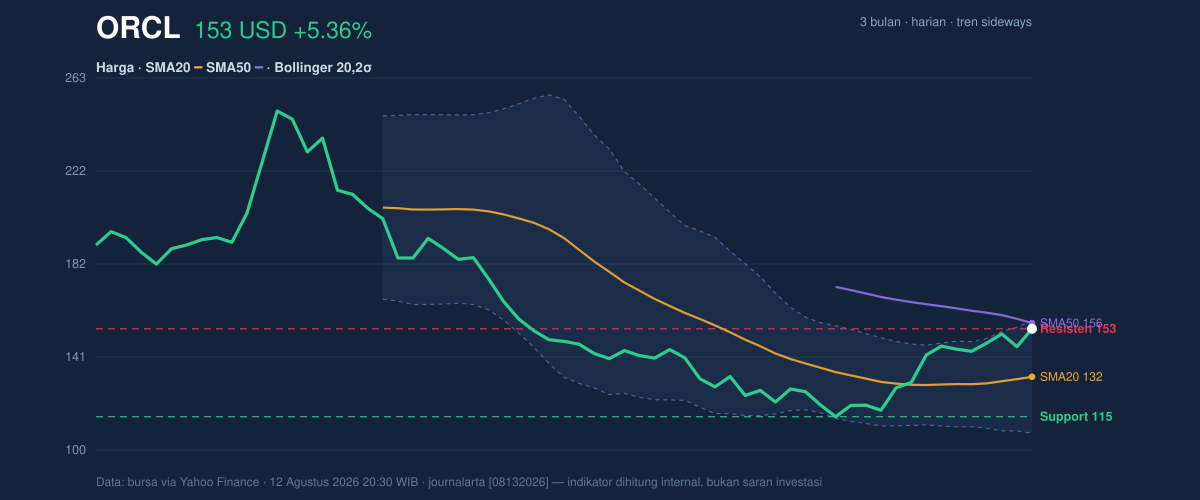
Oracle Corp. shares last traded at 153.28 USD on the NYSE, up 5.36% on the day and 15.69% over the past month, according to Yahoo Finance data cited in the market record for 12 August 2026 at 20:30 WIB. The stock has climbed well above its SMA20 at 132.36, while sitting just under the SMA50 at 155.73. That placement matters: it shows the rebound has been strong enough to recover the shorter trend, but not yet strong enough to reclaim the medium-term average, which often acts as a test of whether the rally is becoming something more durable.
The chart shows a stock that has moved from recovery into a pressure point.
Trend & Price Action
As shown in the chart, Oracle is still labeled sideways, even though the SMA20 slope is rising at 2.46% over 5 days. That combination tells a useful story: the stock is not in a clean, long-running trend, but the short-term path has turned upward fast enough to pull price from the lower half of the range toward the upper end. The absence of a fresh MA-cross means the move has not yet been confirmed by a longer-term trend shift. In plain terms, the recent strength is real, but the market has not fully signed off on a new regime.
The price is also sitting at 100% of its 20-hour range, with support at 114.99 and resistance at 153.28. That is a classic “edge of the box” setup: when a share reaches the top of a range, traders watch to see whether it can break out or whether profit-taking pushes it back inside. The broader three-month range, from 114.50 to 250.25, shows there is still a wide distance between the recent rebound and the higher territory the stock has seen before.
A strong close at the top of the range is constructive, but it also invites scrutiny.
Oscillators & Momentum
The momentum picture is mixed, and that is what makes the current move interesting. The RSI at 59.7 is still neutral, which means the stock is not technically stretched by that measure. RSI is a gauge of whether recent gains or losses have become extreme; at this level, it says Oracle has room to continue moving without immediately flashing a classic overbought warning.
But the Stochastic oscillator is overbought, with %K at 96.0 and %D at 92.0. Stochastic is more sensitive than RSI and tends to flag when price has run too far, too quickly, relative to its recent range. Here, it is doing exactly that: the stock is near the top of its short-term channel, and the oscillator is warning that upside momentum may be stretched. That does not automatically mean a reversal, but it does mean the stock is vulnerable to pauses or pullbacks if buyers lose urgency.
The MACD is positive at 0.445, above its signal line at -4.073, with a histogram of 4.518. In practical terms, MACD is still confirming upward momentum, and the histogram suggests that the gap between the trend and its signal is widening in a bullish direction. So while Stochastic says the move is hot, MACD says the trend is still improving. That tension often appears near inflection points: the rally is strong, but it may need either consolidation or fresh volume to keep climbing.
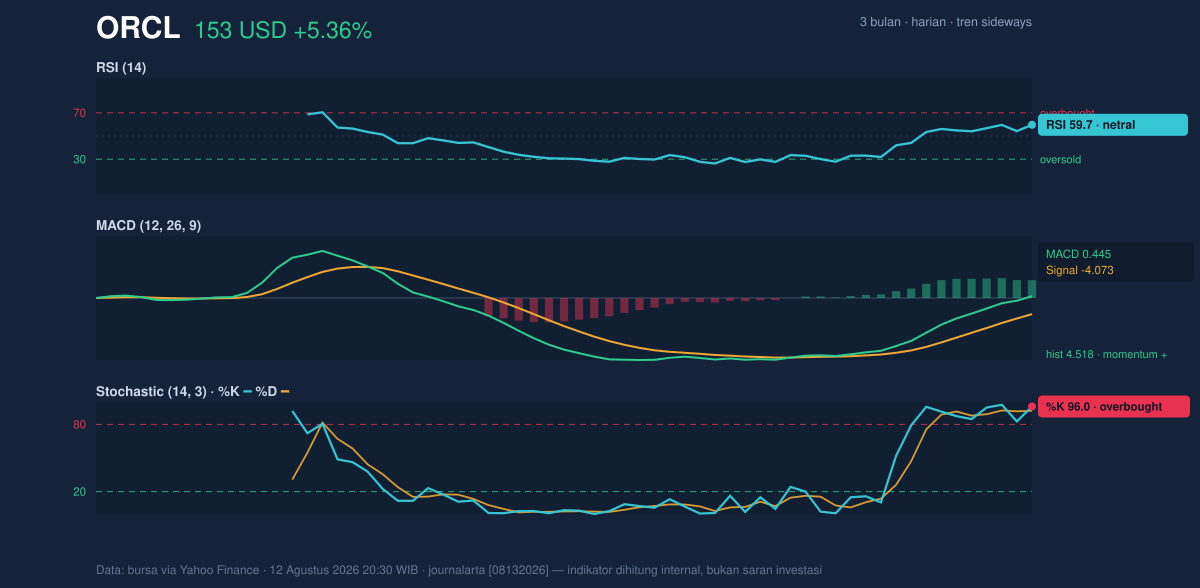
This is not a weak chart; it is a stretched one.
Volatility & Volume
Volatility is elevated, and the market is paying for that movement with wider daily swings. The Bollinger Bands are broadening, with the upper band at 156.90, the middle band at 132.36, and the lower band at 107.83. The %B at 93% shows price is trading very near the upper band, which usually means the stock is near the top of its statistically expected range. The band width of 37.1% indicates the squeeze has ended and volatility is expanding. When bands widen, the market is no longer quiet; it is preparing for larger directional moves, but not necessarily in one straight line.
That is reinforced by ATR at 7.58, or 4.9% of price. ATR measures the average daily range, and this level says Oracle can move quickly enough that short-term traders need to respect sudden reversals. Volume also supports the move: 43,492,800 shares traded versus a 20-day average of 34,524,730, or about 1.3× normal. Rising volume alongside a rising price is usually a sign of participation rather than a thin, fragile bounce. The OBV is rising, which means cumulative volume has been leaning toward buying pressure rather than distribution.
Still, high volume near resistance can mean two different things: accumulation ahead of a breakout, or the last wave of demand before a pause. The chart is close enough to the ceiling that both readings remain in play.
The tape is active, not settled.
Key Levels & Scenarios
The immediate technical map is straightforward. Resistance sits at 153.28, which is also the latest price, so Oracle is effectively testing its own ceiling. Above that, the next obvious reference is the Bollinger upper band at 156.90, and then the SMA50 at 155.73 as a nearby medium-term hurdle. On the downside, support at 114.99 is the key floor from the 20-hour range, while the Bollinger middle band at 132.36 and SMA20 at 132.36 form a major pivot zone where trend strength would be reassessed.
If Oracle can hold above the current ceiling and convert resistance into support, the chart would start to look more like continuation than exhaustion. If it slips back below the middle band, the message changes quickly: the rally would look more like a sharp overshoot inside a still-sideways structure.
Technical Verdict: HOLD (wait & see)
HOLD (wait & see) is the clearest read from the current setup because the chart is strong, but not cleanly resolved.
- MACD is positive and the OBV is rising, which supports the idea that buyers are still participating.
- Stochastic is overbought and price is at 100% of the 20-hour range, which warns the move may be stretched.
- Price is above SMA20 but still below the SMA50 at 155.73, so the medium-term trend has not fully confirmed.
Verdict invalidated if price falls below 132.36, because that would put Oracle back under the short-term trend and the Bollinger middle band.
- Ideal entry range: 132.36 to 153.28
- Exit target: 155.73 to 156.90
- Stop loss protection: 114.99
For non-traders: Oracle has strong short-term momentum, but it is also close to a technical ceiling, so the market is asking for proof before the move can extend.
“The next move will tell us whether this is a breakout or just a very energetic pause.”
Summary Data ORCL
| Last price | 153.28 USD |
| Change 1 day / 5 days / 1 month | 5.36% / 6.16% / 15.69% |
| Trend / MA-cross | sideways / none |
| SMA20 / SMA50 | 132.36 / 155.73 |
| RSI (14) / Stochastic %K | 59.7 / 96.0 |
| Bollinger %B / ATR | 93% / 7.58 |
| Support / Resistance 20 days | 114.99 / 153.28 |
| Data as of | 12 Agustus 2026 20:30 WIB |


