Shell Stock Technicals Today: Gains 0.74%, Momentum Weakens
On Agustus 13, 2026: price 3,322.50 GBp, trend uptrend, RSI 60.5, support 3,129.50, resistance 3,405.50. technical analysis of shell stock.

Shell plc traded firmer on the London Stock Exchange on 11 August 2026, with the shares last changing hands at 3,322.50 GBp, up 0.74% on the day and now sitting above both its short- and medium-term moving averages. The move keeps Shell in an established uptrend, but the message from the indicators is more nuanced: price is still advancing, yet momentum has softened enough to warn that the rally is no longer accelerating cleanly.
Trend & Price Action
The first signal that matters is structure. Shell remains above its SMA20 at 3,286.63 and well above its SMA50 at 3,147.52, which tells traders that the broader directional bias is still upward. The SMA20 is rising by 1.72% over 5 days, a useful sign that the near-term trend has not rolled over. In plain terms, buyers are still in control of the trend line, even if they are not pushing with the same urgency as before.
That said, the share price is not pressing the top of its range. As shown in the chart, Shell is trading around 70% of the 20-hour range, with support at 3,129.50 and resistance at 3,405.50. The stock is also below the Bollinger upper band at 3,419.50, which suggests there is room to move higher before the price becomes stretched. The mid-band at 3,286.63 is effectively the market’s short-term balance point; staying above it keeps the trend constructive, while losing it would imply the recent rise is losing traction.

The lack of a fresh moving-average crossover matters too. No new MA-cross has formed, so this is not a breakout story driven by a new trend regime. Instead, it is a continuation pattern: the existing uptrend is intact, but it still needs confirmation from stronger participation if it is to extend beyond the current ceiling.
Oscillators & Momentum
The momentum picture is mixed rather than bullishly aligned. As shown in the chart, RSI at 60.5 is neutral-to-positive, which means Shell has upside energy but is not in overbought territory. That is constructive, because it leaves some headroom. The Stochastic %K at 65.5 and %D at 44.2 also sit in neutral territory, implying the stock has recovered but has not yet reached the kind of momentum extreme that often precedes a sharp reversal.
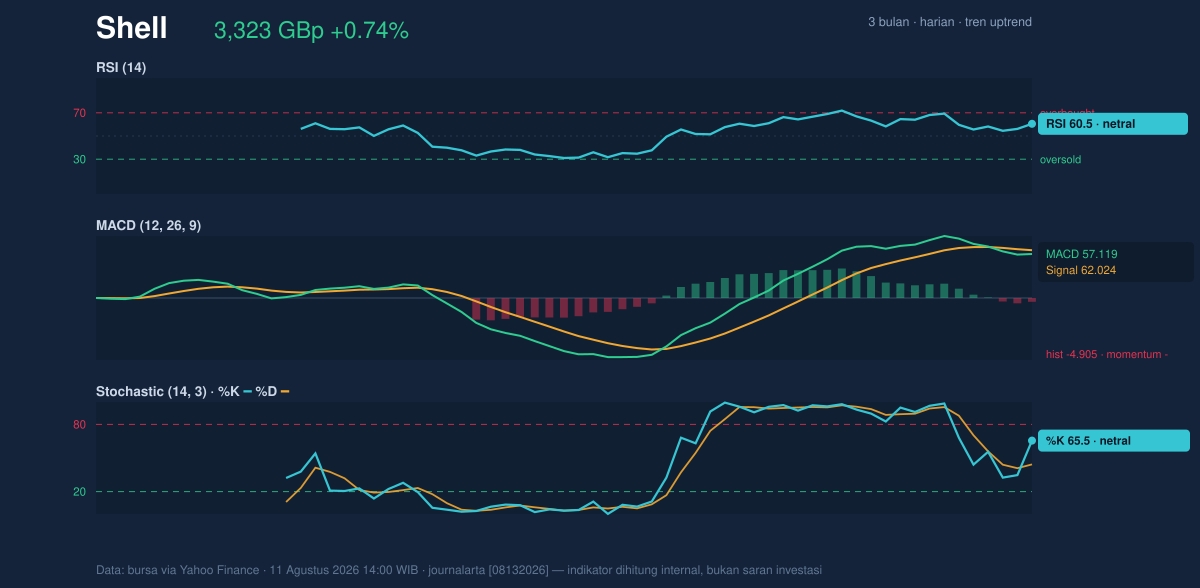
The more important warning comes from MACD at 57.119 versus its signal line at 62.024, with a histogram of -4.905. That negative histogram means short-term momentum has slipped below the longer-term signal, even while price itself remains elevated. In practical terms, the market is still willing to pay up for Shell, but the pace of that willingness has weakened. When price holds up while MACD fades, it often points to consolidation rather than immediate trend extension.
That divergence is not a sell signal on its own. It is a reminder that the current advance is being supported more by trend structure than by fresh momentum thrust. If momentum improves from here, the stock could try to challenge resistance; if it does not, price may simply drift sideways inside the current band.
Volatility & Volume
Volatility is moderate. The ATR(14) at 73.09, equal to 2.2% of price, suggests typical daily swings are manageable rather than explosive. The Bollinger band width of 8.1% is normal, not squeezed and not excessively expanded, which usually means the market is neither coiling for a violent breakout nor already overextended. In other words, the chart is giving Shell some room to breathe, but not a strong volatility signal that would justify expecting a sharp dislocation.
Volume, however, is the softer spot. The latest turnover of 4,198,938 was only 0.5× the 20-day average of 8,340,425, so the day’s rise came on comparatively quiet participation. That matters because price advances on thin volume can be less convincing; they show that sellers are not aggressive, but they do not prove that new money is chasing the move. The one supportive counterweight is that OBV is rising, which indicates cumulative buying pressure has still been building over time. So the tape is not bearish — it is just not emphatically bullish either.
Key Levels & Scenarios
The near-term map is clear. 3,286.63 is the first important pivot because it is both the SMA20 and the Bollinger middle band. Holding above it keeps the trend intact. 3,405.50 is the first resistance to watch, and a move through it would put the 3,419.50 upper Bollinger band into play. Beyond that, the stock would be probing the upper part of its recent trading structure rather than the middle of it.
On the downside, 3,129.50 is the key support that matters most. A break below that level would weaken the current trend narrative and raise the chance that Shell slips back toward the lower half of its range. The broader context still matters too: the stock is trading well above its 3-month low of 2,559.50 and below its 3-month high of 3,758.50, so it is neither deeply depressed nor chasing a fresh peak. That positioning usually leaves a stock vulnerable to consolidation unless momentum starts to re-accelerate.
Technical Verdict: HOLD (wait & see)
HOLD (wait & see) — the trend is positive, but momentum and participation are not yet strong enough to justify treating the move as a clean breakout.
- Trend remains constructive: price is above the SMA20 at 3,286.63 and SMA50 at 3,147.52, with the SMA20 still rising.
- Momentum is mixed: RSI 60.5 and Stochastic 65.5 / 44.2 are neutral, while MACD histogram -4.905 shows fading short-term momentum.
- Participation is light: volume is only 0.5× the 20-day average, so the latest rise lacks strong confirmation.
- Verdict invalidated if price falls below 3,129.50, as that would break the nearest support and weaken the uptrend structure.
- Ideal entry range: 3,286.63 to 3,322.50
- Exit target: 3,405.50 to 3,419.50
- Stop loss protection: below 3,129.50
For non-traders: Shell is still trending higher, but the latest move looks more like a pause within an uptrend than the start of a stronger surge.
“The market is still leaning higher, but it has not yet shown the conviction needed to break the ceiling.”
Summary Data Shell
| Last price | 3,322.50 GBp |
| Change 1 day / 5 days / 1 month | 0.74% / 0.03% / 5.58% |
| Trend / MA-cross | uptrend / none |
| SMA20 / SMA50 | 3,286.63 / 3,147.52 |
| RSI (14) / Stochastic %K | 60.5 / 65.5 |
| Bollinger %B / ATR | 63% / 73.09 |
| Support / Resistance 20 days | 3,129.50 / 3,405.50 |
| Data as of | 11 Agustus 2026 14:00 WIB |


