Singtel Stock Technicals Today: Drops 0.23%, Testing Support Level
On Agustus 13, 2026: price 4.29 SGD, trend sideways, RSI 40.4, support 4.30, resistance 4.61. technical analysis of singtel stock. Singtel Stock Technicals —…

Singapore Telecommunications Ltd. slipped to SGD 4.29 on SGX on 11 August, edging below the previous close of 4.30 as the stock stayed trapped in a sideways pattern with a slight downward tilt. The move is small in absolute terms, but the message is clearer than the size: Singtel is still trying to find demand above the lower end of its recent range, while the broader technical backdrop has yet to turn decisively positive.
Trend & Price Action
The stock is trading below its 20-day average of SGD 4.43, while the 50-day average sits at SGD 4.39. That positioning matters because it shows the short-term trend has weakened enough to lose traction above the near-term mean, but it has not yet collapsed far enough to signal a deeper breakdown. In plain language, the market is hesitating rather than trending hard in either direction.
The 20-day slope is still negative at -0.27% over five days, which reinforces the idea that recent price action has been drifting lower rather than building upward momentum. There has been no fresh moving-average cross, so there is no clean trend reversal signal from the averages yet. As shown in the chart, price is sitting closer to the lower half of its recent band than the upper half, which usually means buyers have not regained control.
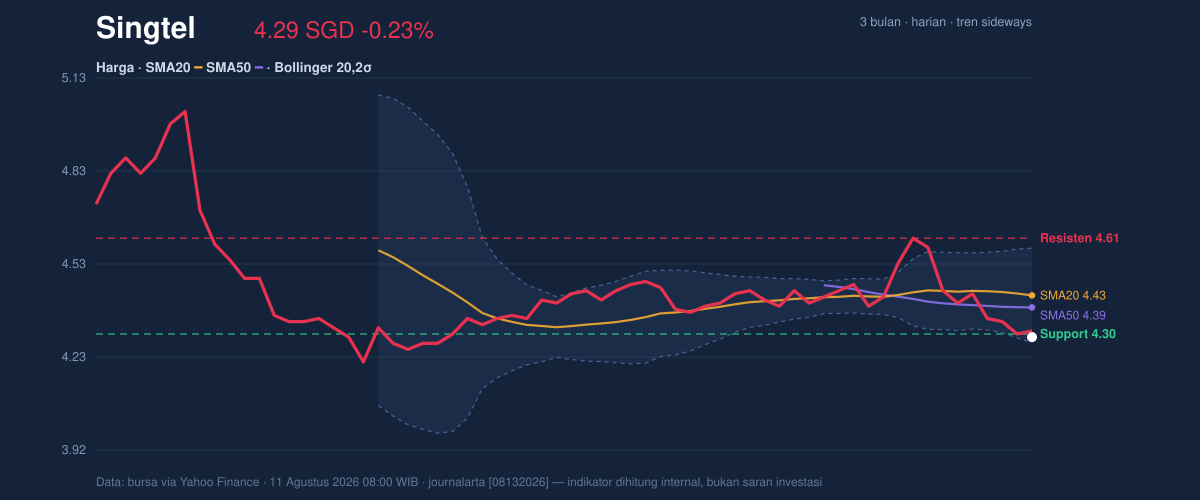
The Bollinger setup adds an important layer. The upper band is at SGD 4.58, the middle band at SGD 4.43, and the lower band at SGD 4.27. With price at SGD 4.29, Singtel is hovering just above the lower band, which often signals a market that is stretched but not yet broken. The band width of 6.9% is relatively tight and points to a squeeze — a phase where volatility compresses before a larger move. That does not tell direction, but it does say the current calm may not last.
The stock is also only a little above its 3-month low of SGD 4.15 and well below the 3-month high of SGD 5.05. That range placement matters because it shows the market has spent more time defending the lower part of the corridor than challenging the top.
Oscillators & Momentum
Momentum is mixed, and that mix is why the chart does not yet support a decisive trend call. RSI at 40.4 is neutral, which means the stock is not oversold enough to imply a reflex rebound on its own, but it is also not overbought. The oscillator is telling us the market has room to move either way, though it currently lacks conviction.
The Stochastic reading is more interesting. %K at 15.2 and %D at 8.4 sit in oversold territory, which usually means the stock has been weak enough that a short-term bounce is possible. But oversold is not the same as bullish. It simply says selling has been persistent enough to press price toward the lower end of its recent range.
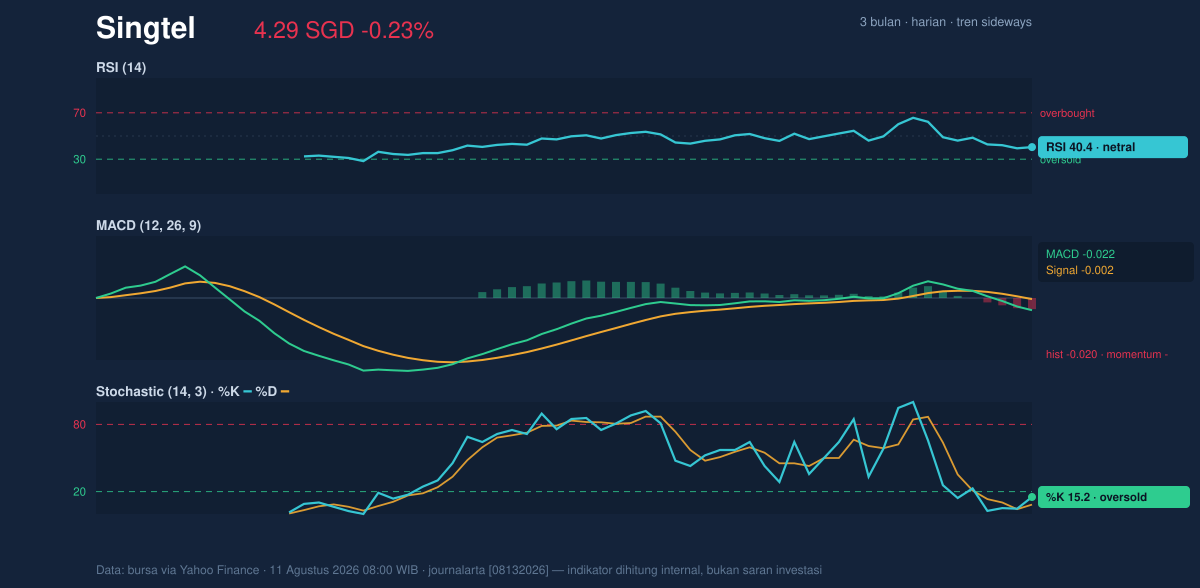
The MACD is still negative at -0.022, with the signal line at -0.002 and the histogram at -0.020. That combination is the clearest evidence that downside momentum still has the upper hand. When MACD remains below its signal line and the histogram stays negative, the market is not yet showing a confirmed shift in trend; it is still leaning toward weakness, even if the slope of that weakness is modest.
Volatility & Volume
Volume does not yet confirm a breakout or a breakdown. The latest turnover of 31,946,300 shares is almost exactly in line with the 20-session average of 32,345,750, or about 1.0× normal. That is important because it suggests the latest decline is not being driven by panic selling or a surge of new participation. Instead, the move looks orderly, almost mechanical, which often happens when a stock is drifting within a range.
OBV, or on-balance volume, is falling, which means volume has recently been more supportive of down days than up days. In practical terms, that hints that sellers have had the edge in recent sessions, even without a dramatic spike in trading activity. ATR at 0.10, or 2.2% of price, points to moderate volatility. So the stock is not dead, but it is not yet in a high-energy phase either.
The combination of a tight Bollinger squeeze and steady volume is often the setup for a move that arrives without much warning. The chart is showing compression, not confirmation.
Key Levels & Scenarios
The nearest support is SGD 4.30, while resistance stands at SGD 4.61. At the moment, price is sitting just below support, which is usually a fragile place to be. If the stock can recover back above the middle Bollinger band at SGD 4.43, that would be the first sign that the recent weakness is losing force. If it fails to reclaim that area, the lower band at SGD 4.27 becomes the next line to watch.
A move toward SGD 4.61 would matter because that level marks the upper edge of the recent trading box and aligns with the idea that buyers would need to prove themselves before the stock can exit its sideways phase. On the downside, a sustained break below the 3-month low of SGD 4.15 would shift the tone from range-bound weakness to something more structural.
Technical Verdict: HOLD (wait & see)
HOLD (wait & see)
- MACD remains negative, so downside momentum is still in place.
- RSI is neutral at 40.4, while Stochastic is oversold, creating a mixed signal rather than a clean reversal.
- Price is below the 20-day average, but the Bollinger bands are squeezing, which raises the odds of a move without giving direction.
- Verdict invalidated if price falls below SGD 4.15, the 3-month low.
- Ideal entry range: SGD 4.27 to 4.30, where the lower band and support cluster.
- Exit target: SGD 4.43 first, then 4.58 if momentum improves.
- Stop loss protection: below SGD 4.15.
In plain English, Singtel is not showing enough strength for a clean trend call, but it is close enough to support that the next move could matter more than the last few small declines.
Summary Data Singtel
| Last price | 4.29 SGD |
| Change 1 day / 5 days / 1 month | -0.23% / -2.50% / -3.16% |
| Trend / MA-cross | sideways / none |
| SMA20 / SMA50 | 4.43 / 4.39 |
| RSI (14) / Stochastic %K | 40.4 / 15.2 |
| Bollinger %B / ATR | 6% / 0.10 |
| Support / Resistance 20 days | 4.30 / 4.61 |
| Data as of | 11 Agustus 2026 08:00 WIB |


