Tencent Momentum Gains: Stock Drops 4.11% (Agustus 13, 2026)
On Agustus 13, 2026: price 461.60 HKD, trend sideways, RSI 51.8, support 434.60, resistance 492.20. technical analysis of tencent stock.

Tencent Holdings fell on the Hong Kong bourse on 11 August, with 0700.HK last at 461.60 HKD, down 4.11% from the previous close of 481.40, as traders reacted to a pullback that left the stock below its short-term average but still inside a broad sideways range.
The move matters because it is not a clean trend break; it is a test of whether recent strength can survive a sharp one-day reset. Tencent is now trading below its SMA20 at 468.79 but above its SMA50 at 456.15, which usually signals a market that has cooled from the near-term momentum without fully surrendering the medium-term structure. In plain English: the stock has lost some short-term traction, but the longer frame has not cracked. The chart shows price sitting in the middle of the broader band rather than at an extreme, which often means direction is still being decided rather than confirmed.
Trend & Price Action
The broader trend is described as sideways, and that fits the setup. The SMA20 is still rising slightly, with a 0.86% five-day slope, but price finishing below that line suggests the latest dip is challenging the short-term drift higher. There is also no fresh MA-cross, so there is no new moving-average signal to imply a major shift in regime. Instead, Tencent is behaving like a stock moving within a range: the 20-hour support at 434.60 and 20-hour resistance at 492.20 frame the immediate battleground, while the three-month low of 411.00 and three-month high of 497.80 define the wider corridor.
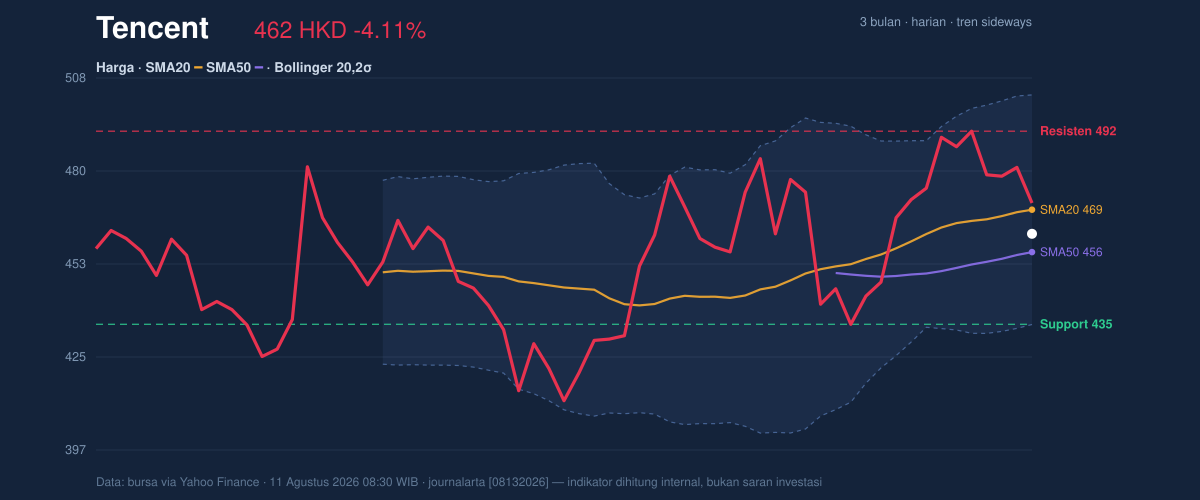
What the price structure says is simple: the market is not in panic, but it is also not rewarding buyers for pushing through overhead supply. Being roughly 47% through the recent range places Tencent near the middle of the box, a zone that often invites choppy trading until one side forces a break.
Oscillators & Momentum
Momentum is mixed rather than bearish. The RSI at 51.8 is neutral, which means the stock is neither overbought nor oversold; it is balanced, waiting for a new impulse. The Stochastic %K at 59.0 and %D at 68.4 also sit in neutral territory, but with %K below %D, the short-term rhythm has softened. That is not a collapse signal; it is a sign that upward speed has eased. The more constructive element is the MACD at 7.515 above its signal line at 6.922, leaving a positive histogram of 0.592. In chart terms, MACD is still pointing to underlying upward momentum, even if price has backed off the highs.
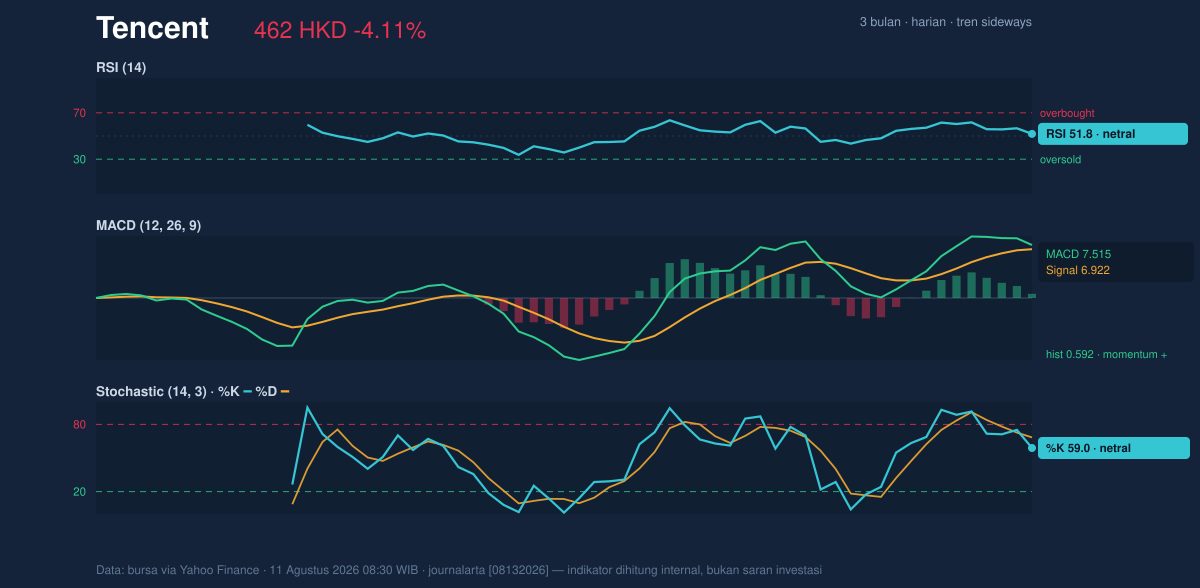
This combination matters. When RSI and Stochastic are neutral but MACD remains positive, the market is usually telling you that the trend has not fully reversed — it is pausing, not necessarily rolling over. The risk is that if price keeps slipping while MACD narrows, that positive momentum can fade quickly.
Volatility & Volume
Tencent’s volatility profile is moderate. The ATR(14) of 13.37, equal to 2.9% of price, suggests daily swings are meaningful but not extreme. Bollinger Bands are also telling a useful story: the middle band at 468.79 matches the SMA20, the upper band at 503.04 caps the near-term upside, and the lower band at 434.54 marks the downside boundary. With %B at 40% and a normal band width of 14.6%, the stock is not in a squeeze that would usually precede a violent breakout. Instead, the bands imply ordinary conditions — enough room for movement, but not the kind of compressed setup that screams imminent expansion.
Volume adds an important nuance. Last trade volume was 19,558,079, below the 20-hour average of 28,566,935, or about 0.7× normal. That means the decline happened without full participation, which often weakens the conviction behind a selloff. At the same time, OBV is rising, and that is a constructive divergence: on balance, more volume has been flowing into the stock than out of it. In other words, the latest drop looks more like a pullback inside an active market than a wholesale exit.
Key Levels & Scenarios
The nearest technical map is clear. 434.60 is the first level to watch on weakness because it aligns closely with the lower Bollinger Band at 434.54. If Tencent holds above that zone, the broader range remains intact and the pullback can be read as contained. If it fails there, the market would be probing deeper toward the 411.00 three-month low, which would signal a more serious deterioration in the range structure.
On the upside, 468.79 — the SMA20 and Bollinger midline — is the first recovery checkpoint. Reclaiming that area would show the stock has regained its short-term footing. Above that, 492.20 is the key resistance to clear, with 497.80 the upper boundary of the three-month range. A move into that zone would tell traders that the recent drop was a setback rather than a change in character.
Technical Verdict: HOLD (wait & see)
HOLD (wait & see)
- RSI 51.8 and Stochastic 59.0 / 68.4 are neutral, so momentum is not decisive.
- MACD remains positive with the histogram above zero, which supports the underlying trend but does not override the price weakness below the SMA20.
- Volume is only 0.7× normal while OBV is rising, suggesting the selloff lacks strong confirmation.
Verdict invalidated if price falls below 434.60, because that would break the nearest support and the lower Bollinger boundary.
- Ideal Entry Range: 434.60 to 456.15
- Exit Target: 492.20 to 497.80
- Stop Loss protection: below 434.54, with the deeper risk marker at 411.00
For non-traders, this means the stock is not giving a clean green light or red light yet — it is sitting in the middle of the road, and the next move needs confirmation. “If 434.60 goes, the tone changes fast,” one trader said, “because then the floor everyone is watching stops being a floor.”
Summary Data Tencent
| Last price | 461.60 HKD |
| Change 1 day / 5 days / 1 month | -4.11% / -5.33% / 1.18% |
| Trend / MA-cross | sideways / none |
| SMA20 / SMA50 | 468.79 / 456.15 |
| RSI (14) / Stochastic %K | 51.8 / 59.0 |
| Bollinger %B / ATR | 40% / 13.37 |
| Support / Resistance 20 days | 434.60 / 492.20 |
| Data as of | 11 Agustus 2026 08:30 WIB |


