UOB Testing Support Level: Stock Drops 3.12% (Agustus 13, 2026)
On Agustus 13, 2026: price 41.95 SGD, trend sideways, RSI 45.9, support 42.16, resistance 44.95. technical analysis of uob stock. UOB Testing Support Level —…

United Overseas Bank’s U11.SI shares fell to 41.95 SGD on the Singapore Exchange on 11 August 2026, after a 3.12% one-day drop from 43.30, leaving the stock below its 20-day average and near the lower half of its recent trading band. The move matters because it is not a clean breakdown, but it does show that sellers still have the upper hand in the short term, even as the chart also hints at a compression phase that can precede a sharper move.
Trend & Price Action
The broader setup is still best described as sideways, but with a slight downward tilt, as shown in the chart. UOB is trading below SMA20 at 43.31 while sitting above SMA50 at 41.26, which usually signals a market caught between short-term weakness and medium-term stability rather than a decisive trend. There is no fresh MA cross, so the chart is not giving a strong trend-confirmation signal either way.
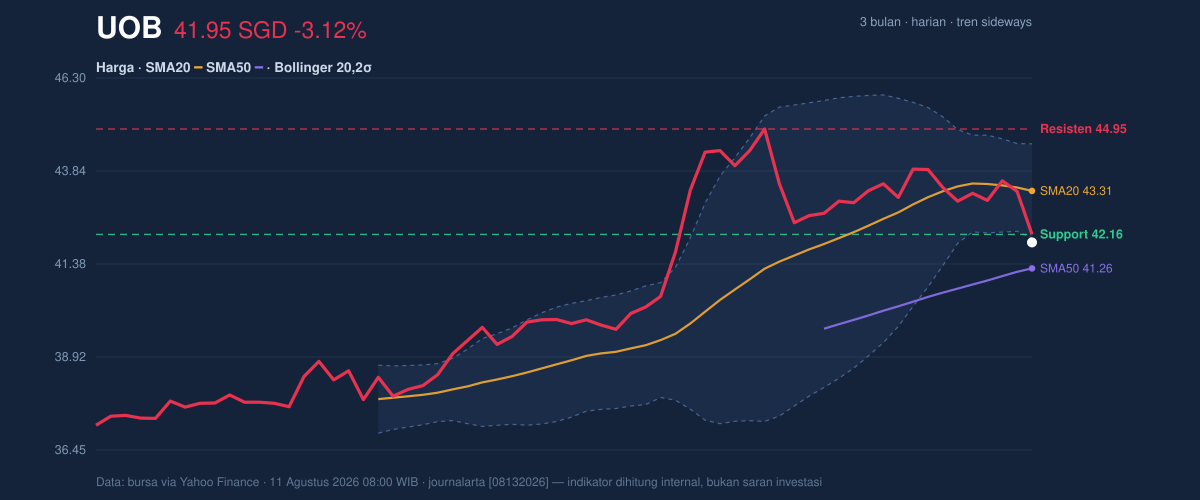
That positioning is important. Price is only a little above the 3-month low of 36.65 and still below the 20-day support cluster, but it is not far enough under the medium-term average to suggest a full trend breakdown. In practical terms, the stock is trying to decide whether it is merely drifting lower inside a range or starting a more meaningful correction.
The nearest support is 42.16, while resistance sits at 44.95. With price currently around 41.95 SGD, UOB is trading below the support level, which is usually a warning that the market has lost some short-term footing. The fact that it is only 8% into the lower end of the range reinforces that the stock is closer to a test of stability than to a breakout attempt.
Oscillators & Momentum
Momentum is mixed, and that mix is telling. The RSI at 45.9 is neutral, meaning the stock is not stretched enough to suggest an immediate reversal from an extreme condition. But the Stochastic reading of 8.2 / 50.4 is much more important here: it shows the short-term price has been pushed into oversold territory, which often means selling pressure has become intense enough to pause or bounce, even if the larger trend has not turned.
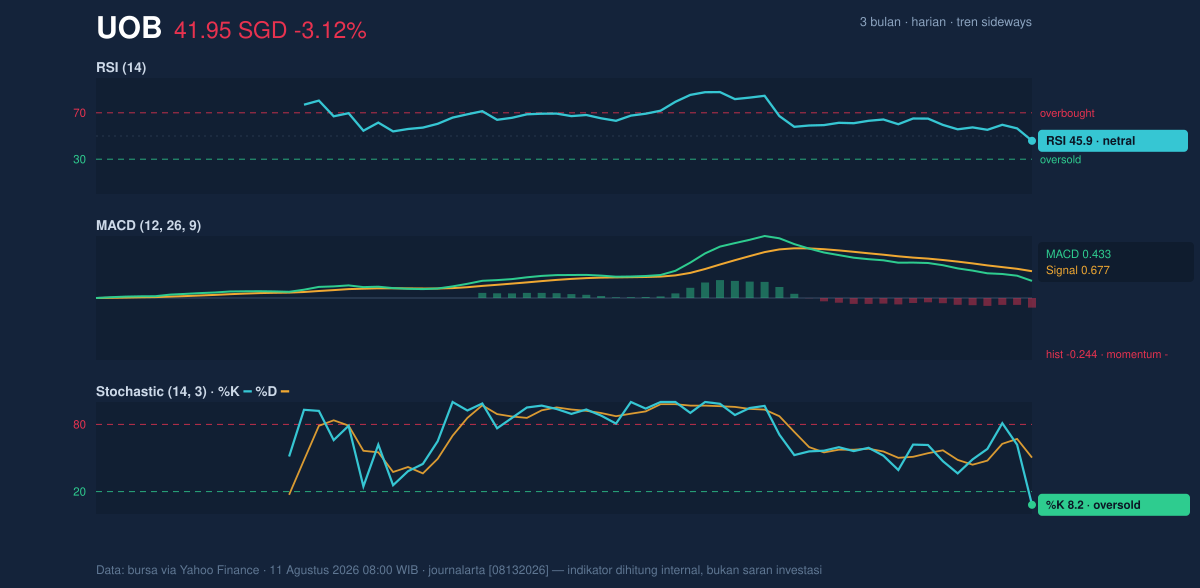
The problem for the bulls is that the MACD does not confirm a recovery yet. The MACD at 0.433 remains below the signal line at 0.677, and the histogram at -0.244 shows negative momentum is still active. In plain English, the stock may be oversold on a short-term basis, but the trend-following indicator has not yet flipped back in favor of buyers. That combination often produces choppy trading rather than an immediate trend reversal.
Volatility & Volume
The Bollinger Bands are especially useful here because they show both direction and pressure. UOB is trading near the lower side of the band structure, with the lower band at 42.06, the middle band at 43.31, and the upper band at 44.56. The %B at -5% suggests price has slipped below the lower band, which usually signals an extended move rather than a healthy consolidation. At the same time, the 5.8% band width is narrow, so the market is in a squeeze phase. That matters because tight volatility often precedes a larger directional move; the chart is coiling, not settling.
Volume adds a second layer of caution. The latest volume of 11,956,500 was about 3.0× the 20-day average of 3,986,898, which means the selloff was not quiet or accidental. It was accompanied by real participation. Yet OBV is falling, and that tells us accumulation is not keeping pace with the heavy turnover. In technical terms, the market is trading actively, but the flow of volume has been leaning against the share price rather than supporting it.
ATR at 0.79, or 1.9% of price, points to moderate volatility. So while the squeeze suggests a bigger move could be coming, the day-to-day swing size is still controlled enough that a key level break would likely matter more than a single noisy session.
Key Levels & Scenarios
The chart’s most important reference points are clear. 42.16 is the first level to watch because it is the nearest support; if the stock cannot reclaim that area, the market remains under pressure. Above that, 43.31 — the SMA20 and Bollinger middle band — is the next technical hurdle, because getting back above it would suggest the recent weakness is easing. The more meaningful ceiling is 44.95, where resistance coincides with the upper end of the recent range.
If UOB can move back above 42.16 and then recover 43.31, the chart would start to look less fragile, with the oversold Stochastic reading potentially turning into a rebound signal. If it fails to hold 41.26, the SMA50, the market would be telling us that the medium-term base has also been lost, and the current sideways pattern would be shifting into a weaker structure.
Technical Verdict: HOLD (wait & see)
HOLD (wait & see)
- RSI at 45.9 is neutral, so there is no strong momentum case for a decisive trend call.
- Stochastic at 8.2 / 50.4 shows oversold pressure, but MACD at 0.433 below signal 0.677 still confirms negative momentum.
- Price below SMA20 at 43.31 and %B at -5% show weakness, but price above SMA50 at 41.26 prevents a full bearish breakdown call for now.
Verdict invalidated if price breaks below 41.26.
- Ideal Entry Range: 41.26 to 42.16
- Exit Target: 43.31 to 44.95
- Stop Loss Protection: below 41.26
In plain English, UOB is not giving a clean trend signal yet, so the chart is asking for patience until either support holds or the medium-term base gives way.
Summary Data UOB
| Last price | 41.95 SGD |
| Change 1 day / 5 days / 1 month | -3.12% / -2.53% / -4.62% |
| Trend / MA-cross | sideways / none |
| SMA20 / SMA50 | 43.31 / 41.26 |
| RSI (14) / Stochastic %K | 45.9 / 8.2 |
| Bollinger %B / ATR | -5% / 0.79 |
| Support / Resistance 20 days | 42.16 / 44.95 |
| Data as of | 11 Agustus 2026 08:00 WIB |


