BP Stock Drops 2.52%, Momentum Weakens In Focus
On Agustus 14, 2026: price 522.40 GBp, trend sideways, RSI 53.0, support 510.20, resistance 555.90. technical analysis of bp stock. BP Stock Drops — full…

BP plc is trading in a narrow band, but the message from the chart is mixed: the shares are holding above longer-term support while still struggling to reclaim the short-term average.
At 522.40 GBp, BP is below its SMA20 at 532.06 but still above its SMA50 at 512.80, which is a classic sideways setup rather than a clean trend. In plain terms, the stock has not broken down, but it also has not proven that recent strength can extend. The latest move — -2.52% on the day — pulled the price back after a modest 1.46% gain over five days and 2.90% over one month, so the broader tape is still constructive, just not decisive.
Trend & Price Action
The structure, as shown in the chart, is best described as consolidation. The sideways trend is backed by the SMA20 slope of 1.28% over five days, which says the short-term average is still rising, but only gradually. That matters because a rising SMA20 often signals that buyers are present, yet the current price sitting below the SMA20 shows that those buyers have not fully reasserted control.
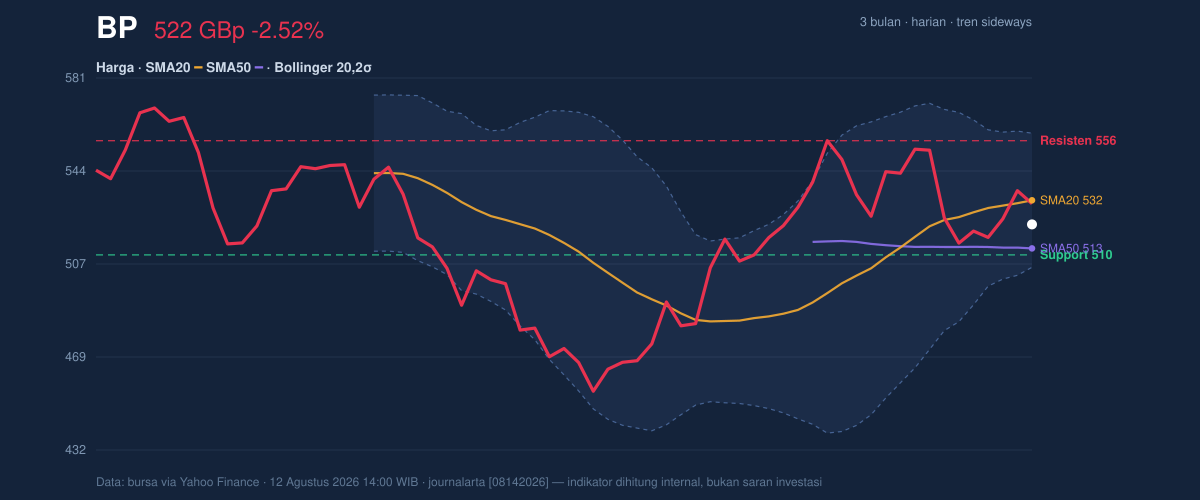
The Bollinger Bands reinforce that picture. With the middle band at 532.06, the upper band at 558.90 and the lower band at 505.21, BP is trading in the lower half of its recent volatility envelope, with %B at 32%. That means price is closer to the lower band than the upper band, but not at an extreme. The 10.1% band width is normal, so this is not a volatility squeeze that usually precedes a sharp breakout. Instead, it suggests the market is still digesting the last move rather than preparing for a dramatic one.
The stock is also sitting at 27% of its 20-hour range between 510.20 support and 555.90 resistance. That positioning is important: it places BP nearer the lower end of the recent range, but still above the key floor. The 3-month high of 575.70 and 3-month low of 450.60 frame the broader range. BP is not near either extreme, which again points to a market waiting for a catalyst rather than one already in motion.
Oscillators & Momentum
Momentum is not bearish enough to confirm a breakdown, but it is weak enough to caution against reading too much into the recent monthly gain.
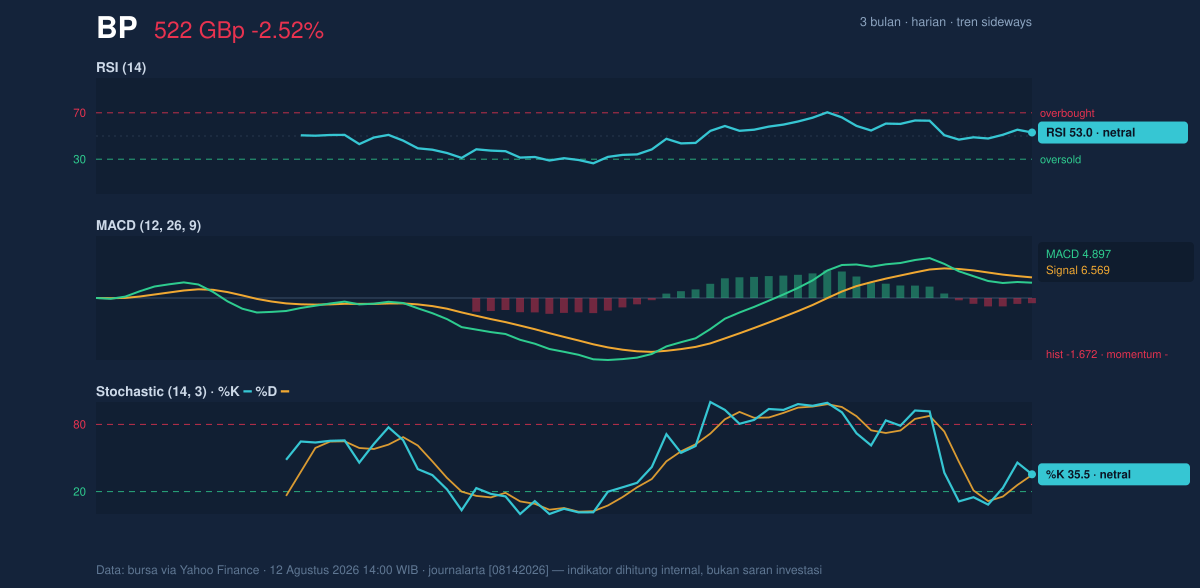
The RSI at 53.0 is neutral, which tells us the stock is neither overbought nor oversold. That is usually a sign of balance, but here it sits alongside a more telling signal: the MACD at 4.897 is still below the signal line at 6.569, leaving a -1.672 histogram. In practical terms, MACD is saying upside momentum has cooled and the recent advance lacks fresh acceleration. This is not a sell signal by itself, but it does show that the latest bounce has not yet turned into a stronger trend.
The Stochastic %K at 35.5 and %D at 34.9 are also neutral, but leaning lower in the range. Stochastic is useful for spotting turning points, and these readings suggest BP is drifting rather than surging. Because the %K and %D are close together, there is no strong crossover signal here — just a market that is neither stretched nor decisively reversing.
Volatility & Volume
Volatility is moderate, not explosive. The ATR(14) at 16.19, equal to 3.1% of price, means BP can still move meaningfully in a session, but the current environment is not unusually turbulent. For readers, ATR is a measure of how much a stock typically moves; a mid-range reading often supports range trading rather than trend chasing.
Volume, however, is the clearest caution flag. Last trade volume was 23,606,418 versus an average of 45,409,694, or about 0.5x normal, and OBV is falling. OBV, or on-balance volume, tracks whether volume is flowing in or out with price. A declining OBV suggests that recent prices have not been backed by strong accumulation. In other words, the market has not shown strong participation behind the move, which makes any rebound less convincing until activity improves.
Key Levels & Scenarios
The immediate line in the sand is 510.20 support. A clean hold there would keep BP inside its current range and preserve the possibility of a move back toward the middle band at 532.06 and then the near-term ceiling at 555.90. If price can reclaim the SMA20 at 532.06, that would improve the technical tone because it would show the stock regaining the short-term trend line.
If BP fails to hold 510.20, the chart opens toward the lower Bollinger band at 505.21, with the broader range reminder that the stock has previously traded down to 450.60 over three months. Conversely, a move through 555.90 would put the upper band at 558.90 in play and would be the first sign that momentum is turning from neutral-to-soft into something firmer.
Technical Verdict: HOLD (wait & see)
HOLD (wait & see) is the cleanest technical read because BP is sitting between support and resistance, with mixed trend signals and weak volume confirmation.
- Reason 1: Price is below the SMA20 at 532.06 but above the SMA50 at 512.80, which is neither a clear uptrend nor a breakdown.
- Reason 2: MACD is negative versus its signal line, showing momentum has faded even though RSI at 53.0 remains neutral.
- Reason 3: volume is 0.5x average and OBV is falling, so the latest move lacks strong participation.
- Verdict invalidated if price breaks below 510.20, because that would weaken the current range floor and expose the lower Bollinger band at 505.21.
- Ideal Entry Range: 510.20 to 532.06 GBp
- Exit Target: 555.90 to 558.90 GBp
- Stop Loss protection: below 505.21 GBp
In simple terms, BP is still inside its range, but it needs stronger momentum and heavier trading to prove the recent bounce is more than a pause. The next scheduled check is whether price can defend 510.20 or regain 532.06 on stronger volume.
Summary Data BP
| Last price | 522.40 GBp |
| Change 1 day / 5 days / 1 month | -2.52% / 1.46% / 2.90% |
| Trend / MA-cross | sideways / none |
| SMA20 / SMA50 | 532.06 / 512.80 |
| RSI (14) / Stochastic %K | 53.0 / 35.5 |
| Bollinger %B / ATR | 32% / 16.19 |
| Support / Resistance 20 days | 510.20 / 555.90 |
| Data as of | 12 Agustus 2026 14:00 WIB |


