RSI Overbought, OCBC Stock Gains 0.45% Today
On Agustus 14, 2026: price 31.50 SGD, trend uptrend, RSI 75.2, support 28.36, resistance 31.36. technical analysis of ocbc stock. RSI Overbought — full details…

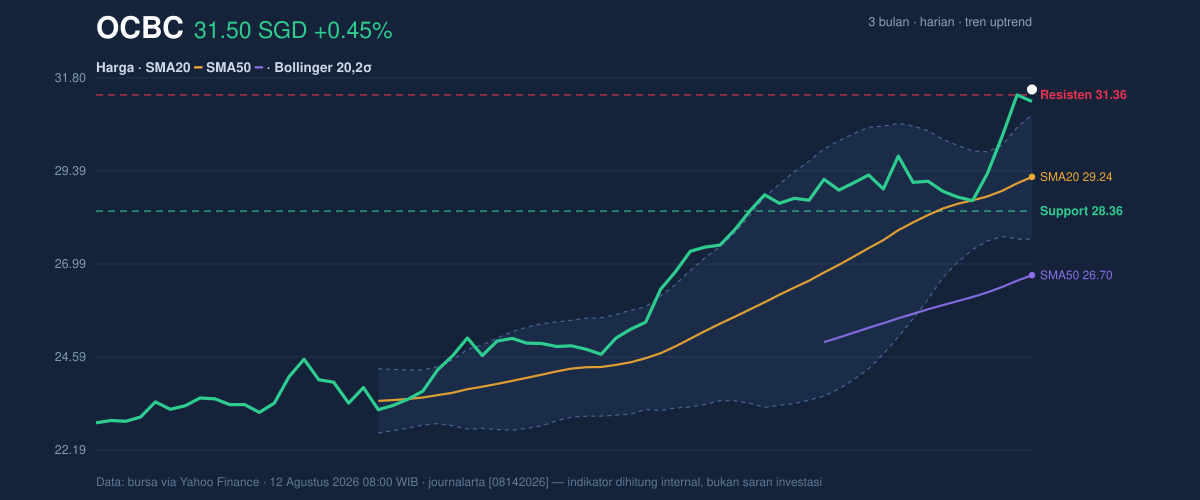
OCBC Bank’s shares on SGX edged to SGD 31.50, up 0.45% on the day, and the move matters less for the size of the gain than for where it landed: the stock is now trading above its recent ceiling, as shown in the chart, while momentum indicators are flashing that the advance has become stretched.
Trend & Price Action
The broader structure is still constructive. OCBC is in an uptrend, with the SMA20 at SGD 29.24 sitting well above the SMA50 at SGD 26.70, which tells traders the medium-term trend remains stronger than the longer baseline. The stock is also sitting above the SMA20, a sign that buyers have kept control of the tape rather than merely reacting to a one-day bounce.
What stands out is the speed of the move. The share price is up 9.68% over five days and 12.98% over one month, and it is now at 105% of the 20-day range, above the stated 20-day resistance at SGD 31.36. That does not automatically mean the move is over, but it does mean the market has already priced in a lot of near-term optimism. The stock is also pressing into the upper end of its three-month range, with the latest price just below the 3-month high of SGD 31.56. In plain terms, OCBC is no longer cheap on a short-term chart; it is testing whether demand can keep pace with the breakout.
Oscillators & Momentum
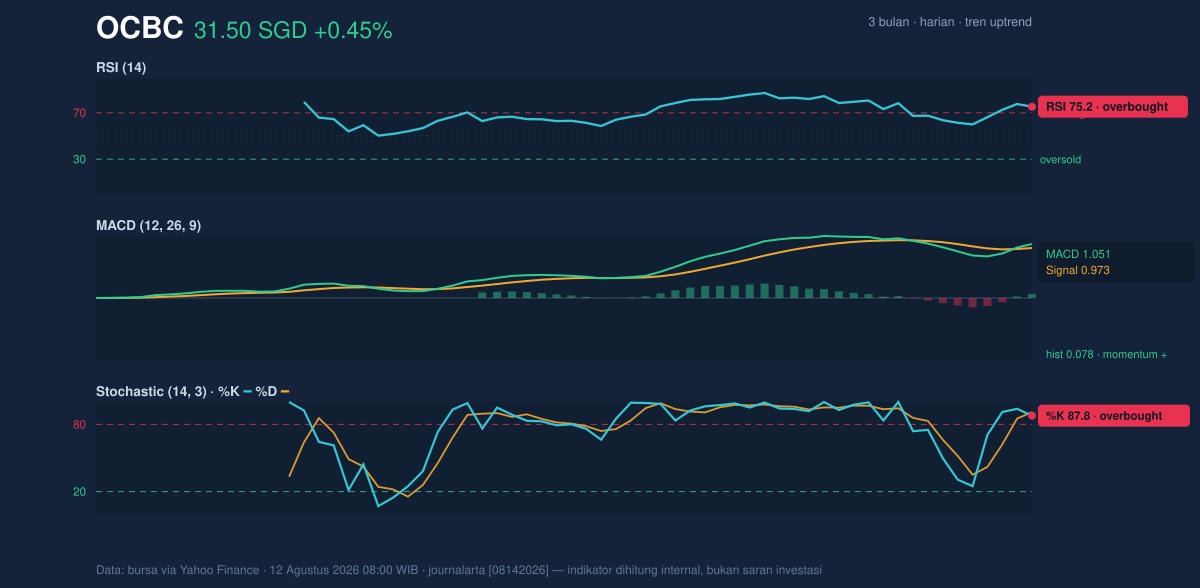
The momentum story is more nuanced. The RSI at 75.2 and Stochastic %K at 87.8 / %D at 91.0 both sit in overbought territory, which usually means the stock has risen quickly enough that it may need consolidation before the next leg higher. Overbought does not mean “about to fall”; it means enthusiasm has become extended, so the market becomes more sensitive to any disappointment.
That warning is partly offset by the MACD. OCBC’s MACD at 1.051 is still above its signal line at 0.973, with a positive histogram of 0.078. This is the cleaner trend-following signal in the set, and it says upward momentum is still intact even if it is no longer fresh. The message from the oscillators is therefore mixed but important: the trend is still up, yet the pace of ascent is now fast enough to invite pauses, pullbacks, or a sideways stretch while the indicators cool.
Volatility & Volume
Volatility is not screaming, but it is not muted either. The ATR(14) of 0.64, equal to about 2.0% of price, suggests a normal trading environment rather than a disorderly one. The Bollinger Bands add another layer: the upper band at SGD 30.85, the middle band at SGD 29.24, and the lower band at SGD 27.64 show price has pushed decisively above the upper volatility boundary. The %B reading of 120% is especially notable, because it means the stock is trading beyond the top band, a classic sign of strong upside pressure but also of a market that may be running ahead of itself in the short run. The 11.0% band width remains normal, so this is not a volatility breakout so much as a price extension inside an orderly channel.
Volume does not yet confirm a full-blown rush of conviction. Last session’s volume of 6,807,900 was only 0.9x the 20-day average of 7,284,605. That matters because a breakout is strongest when it is backed by heavier-than-normal participation. Here, the price has moved above resistance, but the crowd has not shown a dramatic surge. Still, OBV is rising, which means cumulative buying pressure has been improving even without an obvious volume spike. In other words, the market is leaning bullish, but it has not yet produced the kind of volume confirmation that would remove doubt.
Key Levels & Scenarios
The nearest line in the sand is the former resistance at SGD 31.36, which now becomes the first level to watch on any pullback. If the stock can hold above that area, the breakout has a better chance of being accepted by the market rather than rejected as a brief overshoot. Above that, the 3-month high of SGD 31.56 is the immediate reference point for continuation.
On the downside, the most important cushion is the SMA20 at SGD 29.24, which also matches the Bollinger middle band. That level often acts like a trend “gravity point” after an extended move. Below it, the 20-day support at SGD 28.36 becomes the next meaningful test. A slide through that area would suggest the recent breakout has lost momentum and that traders are beginning to lock in gains.
The chart therefore points to a simple setup: OCBC is extended, but not broken. It is trading above trend support, above resistance, and near a fresh high, while momentum is still positive but increasingly overbought.
Technical Verdict: HOLD (wait & see)
HOLD (wait & see)
- RSI 75.2 and Stochastic 87.8 / 91.0 show the stock is overbought, so the rally is stretched.
- MACD 1.051 above signal 0.973 keeps the trend positive, but the move is already extended above the Bollinger upper band at SGD 30.85.
- Volume at 0.9x average means the breakout lacks strong participation, even though OBV is rising.
- Invalidation condition: this verdict is invalidated if price falls below SGD 29.24 and fails to reclaim it, because that would weaken the short-term trend and put the breakout in doubt.
- Ideal entry range: SGD 29.24 to SGD 31.36
- Exit target: SGD 31.56
- Stop loss protection: SGD 28.36
For non-traders, this means OCBC still looks technically healthy, but after a sharp run it is wiser to wait for the stock to prove the breakout can hold rather than chase it at an extended level.
Summary Data OCBC
| Last price | 31.50 SGD |
| Change 1 day / 5 days / 1 month | 0.45% / 9.68% / 12.98% |
| Trend / MA-cross | uptrend / none |
| SMA20 / SMA50 | 29.24 / 26.70 |
| RSI (14) / Stochastic %K | 75.2 / 87.8 |
| Bollinger %B / ATR | 120% / 0.64 |
| Support / Resistance 20 days | 28.36 / 31.36 |
| Data as of | 12 Agustus 2026 08:00 WIB |


