Singtel Stock Drops 1.39% Today, Testing Support Level
On Agustus 14, 2026: price 4.25 SGD, trend sideways, RSI 38.7, support 4.29, resistance 4.61. technical analysis of singtel stock. Singtel Stock Drops — full…

Singtel slipped to SGD 4.25 on the SGX, down from SGD 4.31 at the previous close, after a weak short-term run that leaves the stock sitting near the lower edge of its recent trading band. The move matters less as a one-day setback than as a sign that the shares are still struggling to reclaim the levels where buyers have recently been more comfortable.
Trend & Price Action
The price is now trading below the SMA20 at SGD 4.42 while still slightly above the SMA50 at SGD 4.39, which is a classic signal of a stock that has lost near-term momentum but has not yet broken its broader base. In plain language, the short-term trend is softer than the medium-term one, so the market is not in a clean uptrend or downtrend; it is drifting sideways with a downward tilt.
That reading is reinforced by the chart structure. The stock has fallen 4.06% over five days and 4.28% over one month, while the SMA20 slope is -0.50% over five days. A falling short moving average tells traders that recent prices have been slipping faster than longer-term ones, which usually means rallies are being sold rather than broadly embraced.
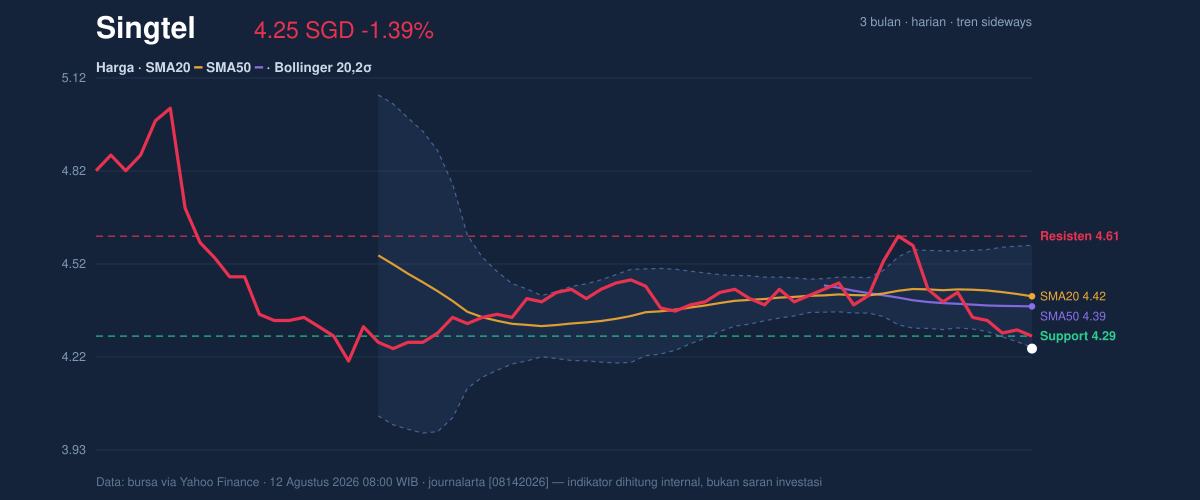
The share price is also sitting at the lower Bollinger band at SGD 4.25, which is important because that often marks the point where a market is stretched on the downside, not necessarily cheap, but vulnerable to a reflex bounce if selling pressure eases. The stock is positioned 12% from the bottom of the 20-day range, with support at SGD 4.29 and resistance at SGD 4.61. That placement shows the market is closer to the floor than the ceiling, but still not convincingly strong enough to claim a reversal.
Oscillators & Momentum
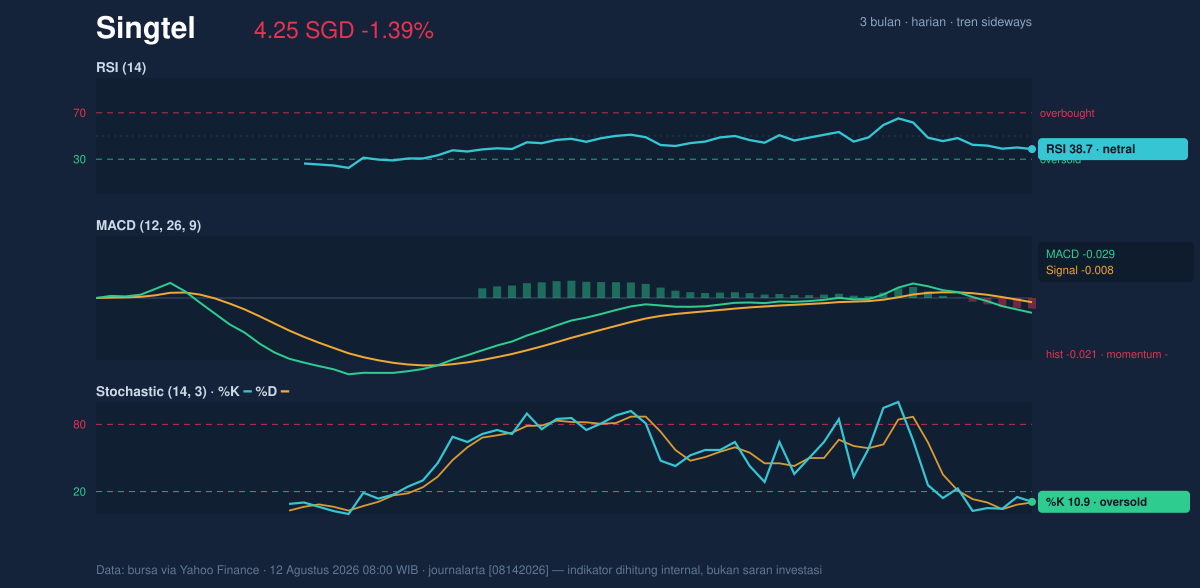
Momentum signals are mixed, and that mix is the central story. The RSI at 38.7 is still technically neutral, but it is leaning weak, meaning the stock is not oversold enough to imply a strong rebound on its own. By contrast, the Stochastic %K at 10.9 and %D at 10.3 are in oversold territory, which tells readers that the latest selling has been heavy enough to push the stock into a short-term exhaustion zone.
The catch is the MACD at -0.029, below its signal line at -0.008, with a histogram of -0.021. That combination means downside momentum is still dominant even if the stock is stretched. In practical terms, oversold conditions can support a bounce, but the MACD says the market has not yet shown the kind of turn that would confirm buyers are back in control.
This is the most important nuance in the chart: the oscillators are not aligned. Stochastic is flashing short-term exhaustion, while MACD still points lower. When those diverge, it usually means the stock may stabilize before it truly reverses, rather than reversing immediately.
Volatility & Volume
Volatility is not extreme, but it is tight enough to matter. The ATR at 0.09, or 2.2% of price, suggests daily moves are moderate rather than wild. More interesting is the Bollinger setup: the band width is only 7.4% and is narrowing, which often signals a squeeze. A squeeze does not predict direction, but it does warn that the current quiet phase may give way to a sharper move once the market chooses a side.
Volume did not provide a strong escape signal. Last volume was 31,694,300, almost exactly in line with the 20-day average of 32,275,575, so the decline was not accompanied by a major surge in trading interest. That matters because heavy volume on a drop would suggest conviction; here, the move looks more like steady pressure than panic.
Still, OBV is falling, and that is a subtle but meaningful sign. On-Balance Volume tracks whether money flow is accumulating or leaving the stock; a declining OBV implies that, even if headline volume is ordinary, the balance of participation has been negative. In other words, the market has been distributing the shares more than absorbing them.
Key Levels & Scenarios
The near-term map is clear. Support sits at SGD 4.29, just above the current price, while resistance is SGD 4.61. The 20-day Bollinger middle band at SGD 4.42 is another important reference because it marks the area where the stock would need to recover to show that the recent weakness is easing.
If SGD 4.29 fails to hold, the chart would likely shift from a sideways drift into a more openly bearish structure, because price would be moving away from the lower end of the recent range and closer to the 3-month low of SGD 4.15. If instead the shares reclaim SGD 4.42 and then work toward SGD 4.61, that would suggest the oversold reading is turning into a tradable rebound rather than a dead-cat bounce.
The broader context is still defined by the 3-month high of SGD 5.05, which shows how much room the stock has given back from earlier strength. That gap is a reminder that the market has not just paused; it has reset expectations.
Technical Verdict: HOLD (wait & see)
HOLD (wait & see) fits the current setup because the stock is near support and oversold on Stochastic, but the MACD remains negative and the price is still below the SMA20. The narrowing Bollinger bands also argue for caution, since the next move could be sharp in either direction rather than orderly.
- Strongest reasons: Stochastic is oversold, price is sitting on the lower Bollinger band, and volume is only normal rather than panic-driven.
- Weakness behind the verdict: MACD is still below signal, OBV is falling, and the stock remains under the SMA20.
- Verdict invalidated if price breaks below SGD 4.29, because that would weaken the current support base and increase the risk of a move toward the recent low zone.
- Ideal Entry Range: SGD 4.25 to SGD 4.29
- Exit Target: SGD 4.42 to SGD 4.61
- Stop Loss protection: below SGD 4.25 or, more conservatively, below SGD 4.29
For non-traders, this means the stock is near a level where it could stabilize, but the chart has not yet proved that the weakness is over.
Summary Data Singtel
| Last price | 4.25 SGD |
| Change 1 day / 5 days / 1 month | -1.39% / -4.06% / -4.28% |
| Trend / MA-cross | sideways / none |
| SMA20 / SMA50 | 4.42 / 4.39 |
| RSI (14) / Stochastic %K | 38.7 / 10.9 |
| Bollinger %B / ATR | -1% / 0.09 |
| Support / Resistance 20 days | 4.29 / 4.61 |
| Data as of | 12 Agustus 2026 08:00 WIB |


