UOB Stock Analysis: Drops 1.09%, Testing Support Level
On Agustus 14, 2026: price 41.70 SGD, trend sideways, RSI 44.2, support 41.95, resistance 44.95. technical analysis of uob stock. UOB Stock Analysis — full…

United Overseas Bank fell to SGD 41.70 on SGX on 12 August 2026, extending a short-term slide that has pushed the share price below its SMA20 at 43.19 while leaving it just above the SMA50 at 41.33. The move matters because it shows UOB is no longer trading in the middle of its recent range; instead, it is leaning on a longer-term floor even as near-term trading pressure remains visible. The chart also shows the stock sitting near the lower edge of its Bollinger band structure, a sign that price is compressed rather than trending cleanly in one direction.
Trend & Price Action
The broader setup is still sideways, but that does not mean calm in the short term. The SMA20 slope of -0.73% over 5 days indicates the recent tone has turned softer, and the fact that price is below the SMA20 but above the SMA50 places UOB in a transitional zone: the medium-term trend has not broken, yet buyers have lost control of the most recent swing. There is no new MA-cross, which suggests the market has not received a fresh trend signal from moving averages; instead, it is waiting for price to resolve the tension between short-term weakness and longer-term support.
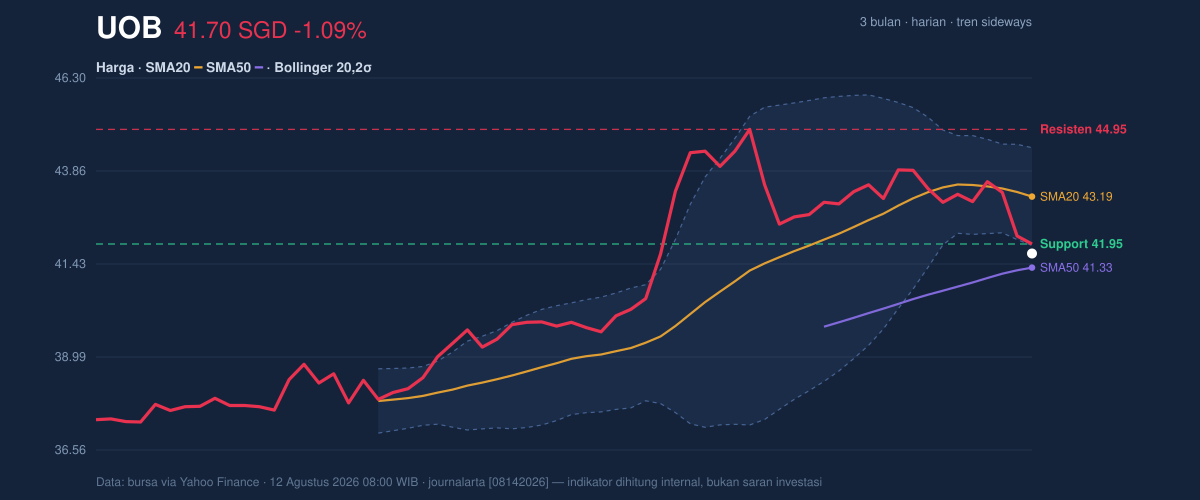
That hesitation is visible in the range data. UOB is trading 8% below the 20-hour resistance at 44.95 and slightly under the 20-hour support at 41.95, which means the stock is pressing against the lower part of its near-term structure rather than testing the top. The 3-month high of 45.15 and 3-month low of 37.07 frame the bigger picture: the current price is still much closer to the upper half of that band, but it has lost enough ground in recent sessions to show that momentum has cooled.
Oscillators & Momentum
The oscillators are mixed, and that mix is important. RSI at 44.2 is neutral, so the stock is neither overbought nor oversold on that measure. In plain English, RSI is saying the market is not stretched enough to force a reversal, but it is also not strong enough to confirm an advance. By contrast, the Stochastic %K at 1.0 and %D at 23.7 point to an oversold condition, which usually means the latest selling has been fast enough to push price toward a short-term exhaustion zone. That does not guarantee a bounce, but it does warn that downside may be closer to a pause point than a fresh acceleration point.
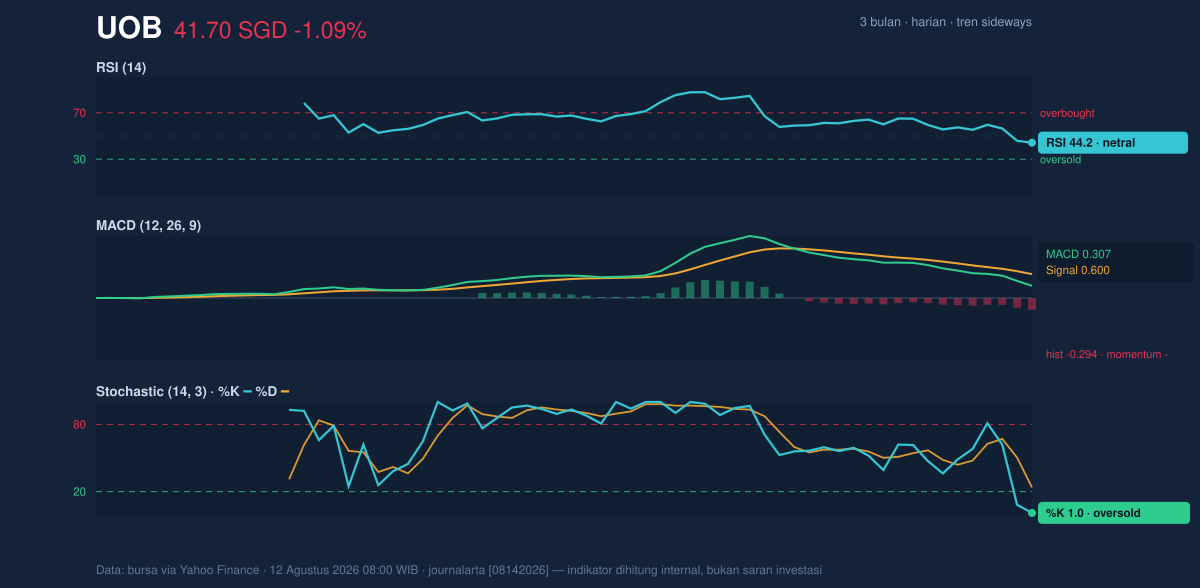
The MACD is negative, with the MACD line at 0.307 below the signal line at 0.600 and a histogram of -0.294. That configuration matters because MACD is a trend-following gauge: when the line sits below its signal, the recent pace of price change is weaker than the broader trend estimate, and the negative histogram shows that weakness is still active rather than fading. Put together, the oscillators suggest UOB is not in a clean reversal yet; it is in a market where the short-term selloff has become stretched, but the trend confirmation still leans negative.
Volatility & Volume
Volatility is contained, but compression is building. The Bollinger band width of 5.9% is narrow, and that squeeze usually signals that the market is storing energy for a larger move. Because price is sitting near the lower band with %B at -8%, the stock is trading below the lower edge of the standard band structure, which often reflects temporary overshoot rather than a stable trend. In practical terms, the chart is telling readers that UOB has moved far enough, fast enough, that the next leg may be more reactive than directional unless volume expands.
That volume confirmation is not yet convincing. Last trade volume of 3,914,300 was only about 1.0× normal against the 20-session average of 4,003,713, so the decline is not being driven by a dramatic surge in participation. The OBV is down, which is a cautionary sign because on-balance volume tracks whether money flow is accumulating or leaving the stock over time. A falling OBV alongside a softer price usually means sellers have had the upper hand in recent sessions, even if the day’s volume itself is not exceptional.
Key Levels & Scenarios
The nearest line to watch is the 41.95 support. If UOB can reclaim and hold above that area, the market may attempt to stabilize around the SMA50 at 41.33 and work back toward the SMA20 at 43.19. If it fails to hold the lower band region and slips beneath the 41.33 SMA50, the next reference point comes from the broader range, where the 3-month low at 37.07 becomes the major downside marker. On the upside, the first meaningful ceiling is the 44.95 resistance, and a move through that zone would matter because it would place price back near the upper band structure and reduce the significance of the current squeeze.
The most important signal is not just where UOB sits, but what that position means: it is near support, below short-term trend, and in a volatility squeeze, which makes the next move more important than the last one.
Technical Verdict: HOLD (wait & see)
- Why this verdict: the price is below SMA20 but above SMA50, which is a mixed trend signal rather than a clear breakdown.
- Why this verdict: Stochastic is oversold, but MACD remains negative, so momentum is stretched without yet turning constructive.
- Why this verdict: Bollinger bands are squeezed and OBV is down, suggesting an imminent move is possible, but direction is not confirmed.
- Invalidation: this verdict is invalidated if price falls below SGD 41.33.
- Ideal Entry Range: SGD 41.33 to SGD 41.95
- Exit Target: SGD 43.19 to SGD 44.95
- Stop Loss protection: below SGD 41.33
For non-traders, this means the stock is sitting at a decision point: weak in the short term, but close enough to support that the next reaction could matter more than the last decline.
Summary Data UOB
| Last price | 41.70 SGD |
| Change 1 day / 5 days / 1 month | -1.09% / -3.58% / -6.04% |
| Trend / MA-cross | sideways / none |
| SMA20 / SMA50 | 43.19 / 41.33 |
| RSI (14) / Stochastic %K | 44.2 / 1.0 |
| Bollinger %B / ATR | -8% / 0.76 |
| Support / Resistance 20 days | 41.95 / 44.95 |
| Data as of | 12 Agustus 2026 08:00 WIB |


