LLY Stock Gains 4.46% Today, Testing Key Resistance
On Agustus 20, 2026: price 1,280.34 USD, trend uptrend, RSI 65.1, support 1,115.68, resistance 1,280.34. technical analysis of lly stock.

Eli Lilly shares rose to USD 1,280.34 on the NYSE, up 4.46% in the latest session, according to exchange-linked data via Yahoo Finance. That move matters less as a one-day pop than as a signal: the stock is now pressing against the top of its recent trading range, and the chart shows buyers have been willing to pay up even after a strong month-long advance. When a large-cap health-care name trades this close to a fresh range high, the market is usually telling you that momentum is still in control — but also that the next leg needs new conviction, not just continuation.
Trend & Price Action
The broader structure remains constructive. Eli Lilly is in an uptrend, with the SMA20 at 1,192.20 and the SMA50 at 1,175.21, while price sits clearly above both. That positioning is important because it shows the stock is not merely bouncing; it is trading above the short- and medium-term trend baselines that many market participants use to judge whether pullbacks are being absorbed or whether rallies are running out of room.
The slope of the SMA20, at 1.04% over 5 days, points higher. In plain terms, that means the average price over the last month is itself rising, which is a cleaner sign of trend persistence than a single strong session. There is no new MA-cross, so the chart is not flashing a fresh trend-change event; instead, it is showing an already-established uptrend that is being extended. As shown in the chart, the price is also at 100% of the 20-hour range, with support at 1,115.68 and resistance at 1,280.34. That tells readers the stock is not sitting in the middle of a consolidation band — it is at the ceiling.
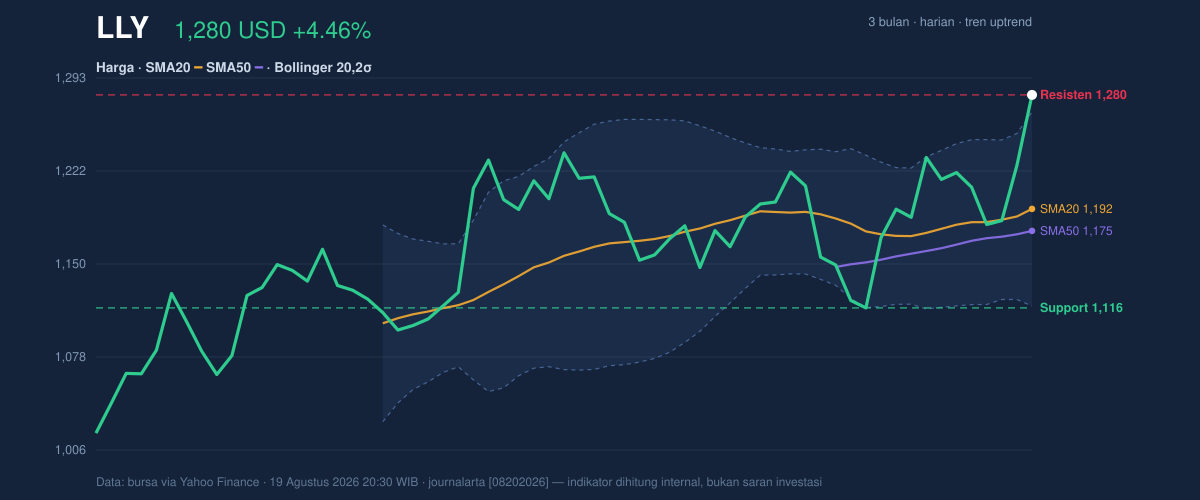
The 3-month high at 1,292.65 now sits just above the current quote, which makes the next few sessions especially sensitive. A clean push through that area would signal that the market is willing to accept a higher valuation zone. Failure to do so would not automatically mean the trend is broken, but it would suggest the stock is pausing after an extended climb.
Oscillators & Momentum
Momentum remains positive, but it is no longer subtle. The MACD at 16.889 is above its signal line at 10.628, with a positive histogram of 6.261. That combination usually means the trend is still being reinforced by buying pressure rather than fading. In practical terms, MACD is not predicting direction on its own; it is showing that recent price gains have been strong enough to outpace the slower trend measure, which is a classic confirmation signal.
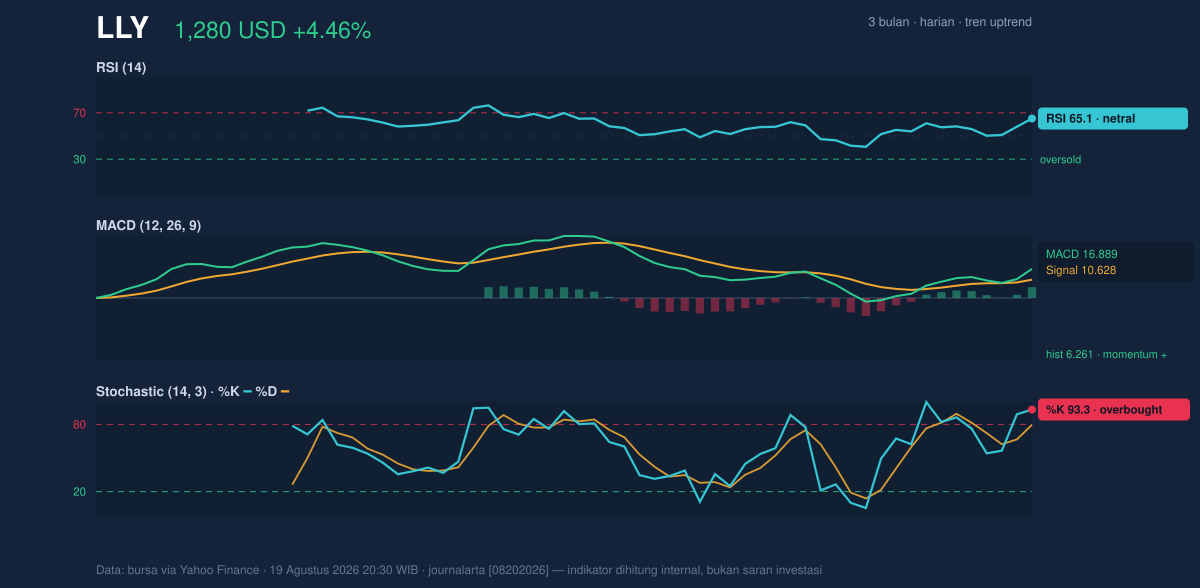
The caution flag comes from the faster oscillators. RSI at 65.1 is still technically neutral, but it is approaching the zone where rallies can start to look stretched. More notably, Stochastic %K at 93.3 and %D at 79.6 are in overbought territory. That does not mean the stock must fall; it means the latest advance has become fast enough that the market may be vulnerable to a pause, a sideways drift, or a brief pullback as traders who bought earlier begin to lock in gains.
This is where the signals matter more than the labels. Overbought Stochastic readings in a strong uptrend often describe speed, not necessarily exhaustion. But when they appear alongside a price that is already at the top of its range, they warn that upside may need a fresh catalyst to keep expanding at the same pace.
Volatility & Volume
The Bollinger setup adds another layer. Price is trading above the upper band, with %B at 109%, while the band width is 12.6%, described here as normal. That combination means the stock has pushed beyond its usual statistical envelope, which often happens during strong directional moves. It is a sign of strength, but also of extension: price is running ahead of the middle band, not hugging it.
The ATR(14) at 45.99, or 3.6% of price, says daily swings are relatively large. For readers, ATR is a measure of typical movement, not a forecast; a higher reading means the stock can travel farther in either direction in a given session. That matters here because an extended stock with high ATR can reverse quickly if momentum cools.
Volume supports the move. The latest 4,538,100 shares traded versus a 20-day average of 2,793,255, a 1.6x jump, and OBV is rising. That is a meaningful confirmation signal: the advance is not happening in thin trade. Rising OBV suggests money flow has been net positive, which strengthens the case that the breakout attempt is being backed by participation rather than a handful of low-volume prints.
Key Levels & Scenarios
The nearest hard reference points are straightforward. Support at 1,115.68 is the first level where buyers have previously shown up, while resistance at 1,280.34 is now effectively the current test. Above that, the 3-month high at 1,292.65 becomes the next visible ceiling.
If price can hold above the upper Bollinger band and clear 1,292.65, the chart would be telling us that the market is accepting a new high zone rather than merely probing it. If it fails to extend and starts slipping back below the upper band, the likely message is not trend failure but digestion: momentum is cooling after a strong run. A deeper fade toward the mid-band at 1,192.20 would indicate the stock is reverting toward its trend average.
Technical Verdict: HOLD (wait & see)
HOLD (wait & see)
- MACD remains positive and the histogram is still expanding, which supports the underlying uptrend.
- Price is above SMA20 and SMA50, confirming trend strength, but it is also stretched above the upper Bollinger band.
- Stochastic is overbought and price is at the top of the 20-hour range, which raises the odds of a pause or pullback before any further advance.
Verdict invalidated if price falls below 1,115.68.
- Ideal Entry Range: 1,192.20 to 1,267.28
- Exit Target: 1,292.65
- Stop Loss: below 1,115.68
In plain English: the trend is still healthy, but the stock is stretched enough that the next move may be a pause before another push higher.
“The market is still paying up for Lilly, but it is also asking whether this latest burst can keep going without a breather.”
Summary Data LLY
| Last price | 1,280.34 USD |
| Change 1 day / 5 days / 1 month | 4.46% / 4.92% / 10.09% |
| Trend / MA-cross | uptrend / none |
| SMA20 / SMA50 | 1,192.20 / 1,175.21 |
| RSI (14) / Stochastic %K | 65.1 / 93.3 |
| Bollinger %B / ATR | 109% / 45.99 |
| Support / Resistance 20 days | 1,115.68 / 1,280.34 |
| Data as of | 19 Agustus 2026 20:30 WIB |
Track LLY stock price daily: live levels, support/resistance and our full LLY analysis history.


