AIA Momentum Weakens: Stock Gains 0.28% (Agustus 21, 2026)
On Agustus 21, 2026: price 72.75 HKD, trend sideways, RSI 43.4, support 70.40, resistance 79.65. technical analysis of aia stock. AIA Momentum Weakens — full…

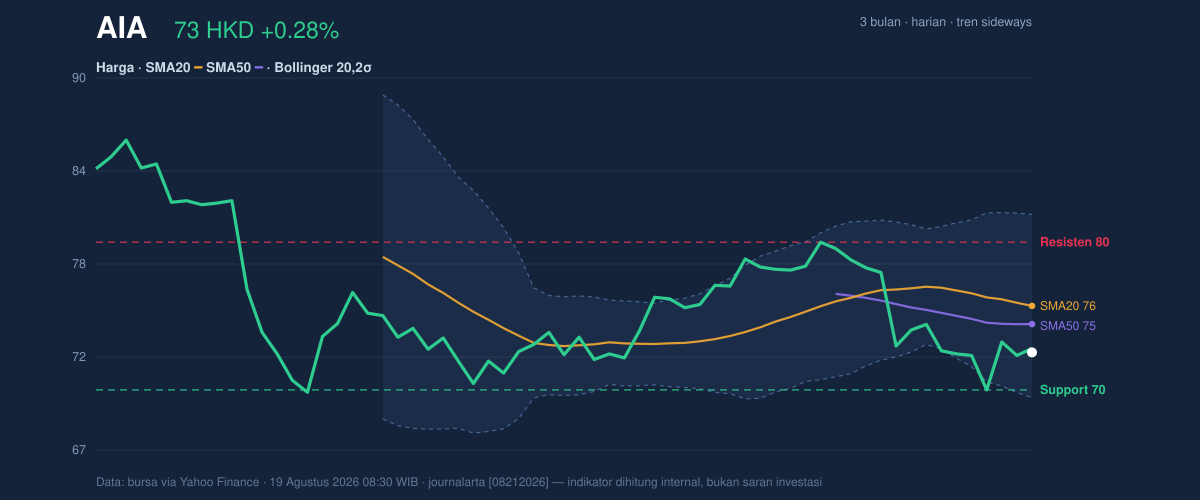
AIA Group closed at HK$72.75, up 0.28% from the previous close of HK$72.55, but the bigger signal is not the one-day gain. The stock is still trading below its SMA20 at HK$75.66 and SMA50 at HK$74.52, which tells traders the recent bounce has not yet repaired the broader short-term downtrend. With the 1-month change at -5.40% and the chart still classed as sideways, AIA is sitting in a range where direction is being tested rather than confirmed.
Trend & Price Action
The price is now positioned in the lower quarter of its 20-hour range, with support at HK$70.40 and resistance at HK$79.65. That placement matters because it shows the market is closer to the floor than the ceiling, but not yet close enough to say the floor is secure. The stock also remains well below the 3-month high of HK$87.05, while staying above the 3-month low of HK$69.05, which is a classic sign of a range-bound name losing some upward momentum without fully breaking down.
The absence of a fresh MA-cross means the moving averages have not delivered a clean trend signal. In plain terms, the market has not produced the kind of crossover that often marks a stronger shift in direction. Instead, the mild negative slope in SMA20 at -1.26% over 5 days suggests the near-term trend is still leaning lower, even if the move has not been disorderly. As shown in the chart, price is trading under the shorter moving averages while the Bollinger structure remains intact.
Oscillators & Momentum
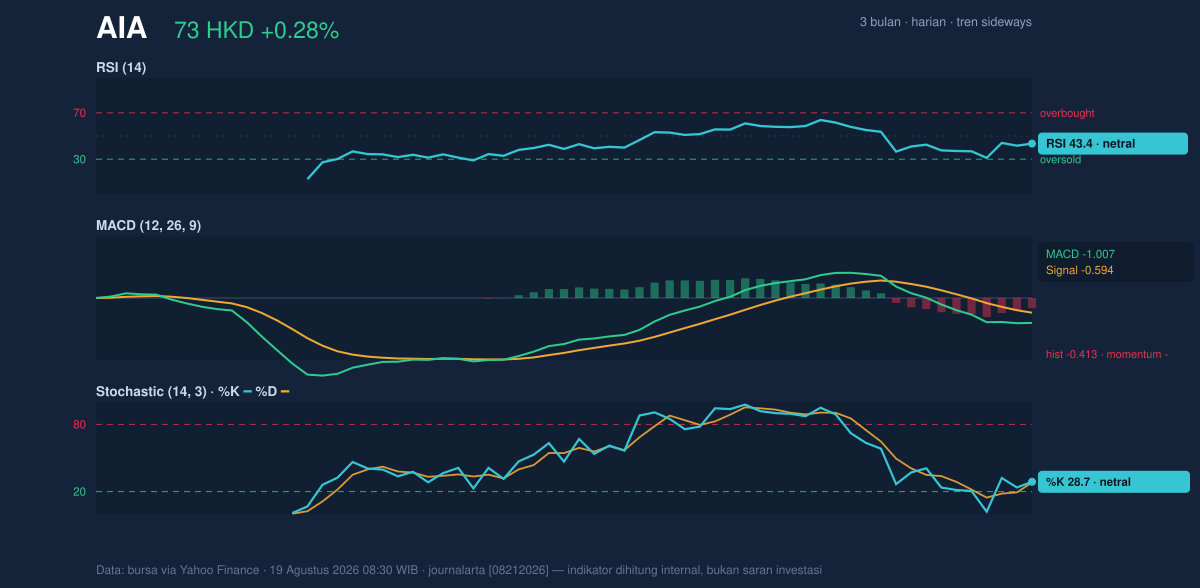
The momentum picture is mixed, but not supportive enough to call a turn. RSI at 43.4 is neutral, which means the stock is neither oversold nor overbought; it is simply not showing strong buying pressure. Stochastic %K at 28.7 and %D at 28.2 sit near the lower end of the scale, suggesting the stock is weak but not yet flashing a full reversal signal. That combination usually means sellers have the upper hand, though the market is approaching a zone where downside speed can start to slow.
The more important warning comes from MACD at -1.007, with the signal line at -0.594 and the histogram at -0.413. MACD is a trend-following indicator, and when it stays below the signal line, it implies downside momentum is still dominant. The negative histogram reinforces that message: the recent price action is not yet strong enough to overtake the prevailing drift lower. As shown in the momentum chart, the oscillators are not aligned with a fresh upside breakout.
Volatility & Volume
Bollinger Bands are giving a useful read on where risk sits. The stock is trading at a %B of 25%, which means price is positioned in the lower part of the band structure, closer to the lower band at HK$69.92 than the upper band at HK$81.39. That usually signals a market that is weak but not necessarily stretched enough to force a reversal. The 15.2% band width is normal, so this is not a squeeze setup that often precedes a sharp expansion. In other words, the tape is not coiling for an obvious breakout; it is drifting inside a familiar envelope.
ATR at 2.18, or 3.0% of price, points to moderate volatility. That is important because it suggests price can move, but not in a highly explosive way unless a catalyst appears. Volume adds another layer of caution. The latest turnover of 25,886,292 is below the 20-hour average of 29,496,178, at 0.9x normal, while OBV is falling. OBV, or on-balance volume, tracks whether volume is supporting price direction. A falling OBV during a weak price phase usually means participation is not confirming a stronger recovery attempt.
Key Levels & Scenarios
The key technical map is straightforward. HK$70.40 is the nearest support, and it sits just above the 3-month low of HK$69.05. If that support gives way, the chart would be exposed to a retest of the lower end of the recent range. On the upside, HK$75.66 at the SMA20 is the first meaningful hurdle, followed by HK$79.65 resistance and then the HK$81.39 upper Bollinger band. A move back above the moving averages would matter because it would show the stock is reclaiming levels that currently cap the rebound.
If price holds above HK$70.40 and momentum starts to improve, the market could spend more time rebuilding inside the range. If it fails to hold that level, the weak MACD and falling OBV would become more relevant, because both would be pointing to a market that lacks enough demand to defend support. The current setup is therefore less about a confirmed trend and more about whether the stock can stabilize before the lower boundary is tested again.
Technical Verdict: HOLD (wait & see)
HOLD (wait & see)
- Price remains below SMA20 and SMA50, so the short-term trend is still under pressure.
- MACD is negative and the histogram stays below zero, showing momentum has not turned supportive.
- Volume is below average and OBV is falling, which means the rebound lacks strong participation.
- Verdict invalidated if price breaks below HK$70.40; that would expose the lower range area near HK$69.05.
Ideal technical levels based on the chart: Entry Range: HK$70.40 to HK$75.66; Exit Target: HK$79.65 to HK$81.39; Stop Loss protection: below HK$69.05.
For non-traders, this means the stock is not showing a clean recovery signal yet, but it is also not in a confirmed breakdown.
Latest fact: AIA’s last price stood at HK$72.75 as of 19 August 2026, 08:30 WIB, with volume at 25,886,292.
Summary Data AIA
| Last price | 72.75 HKD |
| Change 1 day / 5 days / 1 month | 0.28% / 0.14% / -5.40% |
| Trend / MA-cross | sideways / none |
| SMA20 / SMA50 | 75.66 / 74.52 |
| RSI (14) / Stochastic %K | 43.4 / 28.7 |
| Bollinger %B / ATR | 25% / 2.18 |
| Support / Resistance 20 days | 70.40 / 79.65 |
| Data as of | 19 Agustus 2026 08:30 WIB |
Track AIA share price daily: live levels, support/resistance and our full AIA analysis history.

