DBS Stock Technicals Today: Gains 0.16%, Testing Key Resistance
On Agustus 21, 2026: price 75.84 SGD, trend uptrend, RSI 61.1, support 73.50, resistance 76.99. technical analysis of dbs stock. DBS Stock Technicals — full…

DBS Group’s shares were last at 75.84 SGD, up 0.16% on the day and sitting just above the 75.03 20-day average, according to SGX data via Yahoo Finance at 19 August 2026 08:00 WIB. The stock is still in an uptrend, but the message from the tape is more nuanced than the headline gain suggests: price is holding near the upper half of its recent range, volume is running below normal, and momentum gauges are no longer fully aligned. In plain terms, DBS is still climbing, but the pace has slowed.
Trend & Price Action
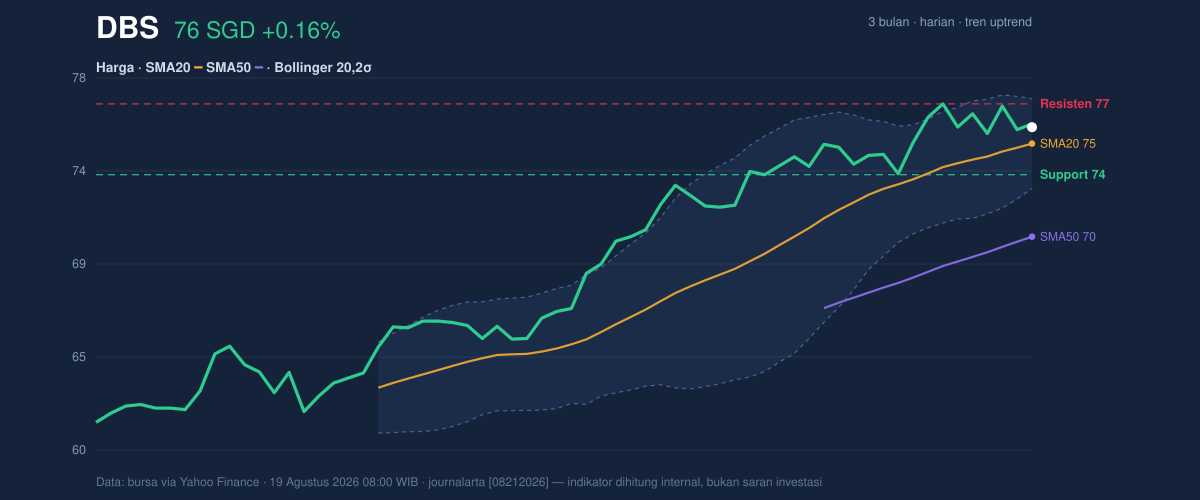
The broader structure remains constructive. DBS is trading well above its SMA50 at 70.45 and above the SMA20 at 75.03, which tells traders the medium-term trend is still intact and the short-term trend has not broken down. The 1.30% rise in the SMA20 over 5 days is important: it shows the average price itself is still rising, a sign that buyers have not lost control. There is no fresh MA-cross, so the chart is not flashing a new trend-change signal; instead, it is showing an established advance that is now pausing near resistance.
The stock is also trading at 67% of its 20-hour range, which places it above the midpoint but not yet at the top of the band. That positioning matters because it suggests the market is leaning bullish without having fully committed to a breakout. The 3-month high of 77.97 is close enough to act as an overhead reference point, while the 3-month low of 61.00 remains far enough away to confirm the uptrend has room to breathe.
A short rise, but not yet a breakout.
Oscillators & Momentum
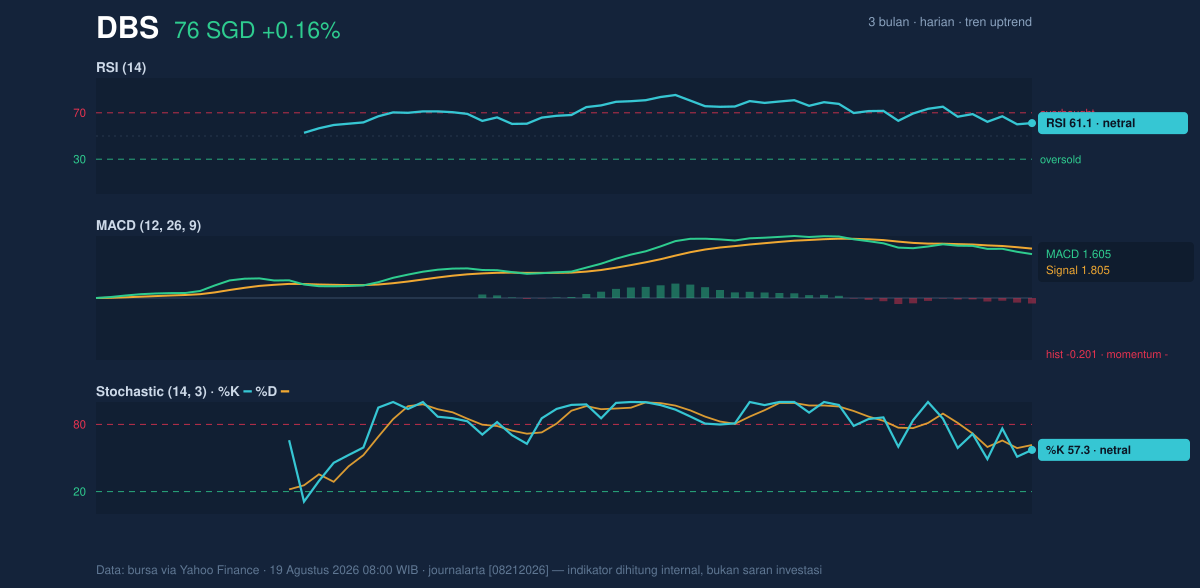
The momentum picture is more restrained than the trend. RSI at 61.1 is neutral, which means DBS is not overbought and still has room to extend if fresh demand arrives. The Stochastic %K at 57.3 and %D at 61.6 are also neutral, reinforcing the idea that the stock is neither stretched nor washed out. That combination usually points to a market that is consolidating gains rather than accelerating sharply.
The caution flag comes from MACD. The MACD at 1.605 remains above zero, which is generally consistent with an upward bias, but it sits below the signal line at 1.805 and the histogram at -0.201 is negative. That means the recent push is losing some internal strength even though the broader trend is still up. Put simply, the trend is intact, but momentum is not confirming with the same enthusiasm.
That is the difference between strength and speed.
Volatility & Volume
Bollinger Bands are telling an important story. The upper band sits at 77.24, the middle at 75.03, and the lower at 72.82. With %B at 68%, price is above the middle band but still below the upper band, which signals a bullish tilt without a full extension. More interesting is the 5.9% band width, described as a squeeze. That usually means volatility has compressed and the market may be preparing for a larger move. Compression does not predict direction on its own, but it often precedes expansion.
ATR adds context: 1.33, or about 1.8% of price, indicates moderate volatility. That is consistent with a stock that is not swinging wildly, but is still capable of moving enough to test nearby barriers if a catalyst appears.
Volume is the missing piece for now. The latest turnover of 3,244,400 is only 0.7x normal versus the 20-hour average of 4,850,625. That suggests the latest advance is not being backed by strong participation. Yet OBV is rising, which is a constructive sign because on-balance volume tracks whether accumulation is gradually outweighing distribution. The tension between softer spot volume and rising OBV often means buyers are present, but not aggressively.
Key Levels & Scenarios
The market is now boxed in between support at 73.50 and resistance at 76.99. Because price is already near the upper part of that band, the next move matters. A sustained push through 76.99 would bring the 77.24 Bollinger upper band and the 77.97 3-month high into focus; that is the area where the chart would need stronger participation to validate a continuation. If DBS fails to hold the 75.03 mid-band and slips toward 73.50, the message would shift from consolidation to test of trend support.
The chart, as shown in the price action panel, suggests a market waiting for confirmation rather than one already in motion.
Technical Verdict: HOLD (wait & see)
HOLD (wait & see) because:
- Trend remains positive: price is above SMA20 75.03 and well above SMA50 70.45.
- Momentum is mixed: RSI 61.1 and Stochastic are neutral, but MACD histogram -0.201 shows fading upside momentum.
- Volatility is compressed: the 5.9% Bollinger squeeze suggests a move may be coming, but direction is not yet confirmed.
Verdict invalidated if price falls below 73.50, which would weaken the current support structure and challenge the near-term uptrend.
- Ideal Entry Range: 73.50 to 75.03
- Exit Target (Target Price): 76.99 to 77.24
- Stop Loss protection: below 72.82
For non-traders: DBS still looks technically healthy, but it has not yet shown the volume and momentum needed to prove the next leg higher.
“It’s a market waiting for conviction, not a market already convinced.”
Summary Data DBS
| Last price | 75.84 SGD |
| Change 1 day / 5 days / 1 month | 0.16% / -0.01% / 5.33% |
| Trend / MA-cross | uptrend / none |
| SMA20 / SMA50 | 75.03 / 70.45 |
| RSI (14) / Stochastic %K | 61.1 / 57.3 |
| Bollinger %B / ATR | 68% / 1.33 |
| Support / Resistance 20 days | 73.50 / 76.99 |
| Data as of | 19 Agustus 2026 08:00 WIB |
Track DBS share price daily: live levels, support/resistance and our full DBS analysis history.

