HSBC Stock Drops 0.79% Today, Testing Support Level
On Agustus 21, 2026: price 1,502.60 GBp, trend sideways, RSI 44.6, support 1,497.20, resistance 1,597.40. technical analysis of hsbc stock.

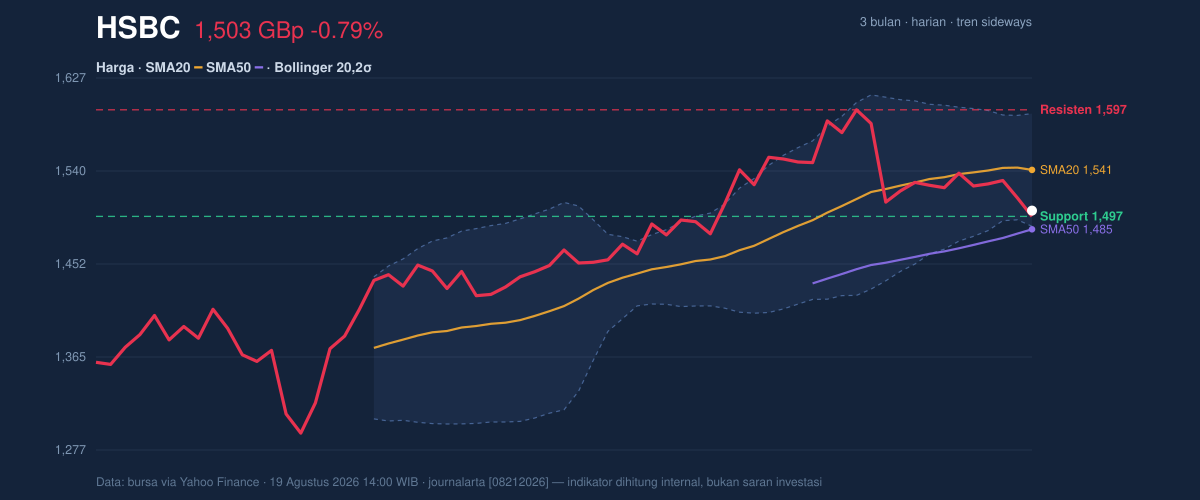
HSBC Holdings (HSBA.L) fell 0.79% to 1,502.60 GBp in London trading on 19 August 2026, leaving the shares just above the 1,497.20 short-term support and below the 1,540.90 20-day average, a position that signals the stock is still in a sideways phase but leaning weak in the near term. The move matters because HSBC is not breaking down decisively, yet it is also not reclaiming the level that would show buyers have regained control. As shown in the chart, the price sits inside a narrowing Bollinger band, which often means the market is waiting for a catalyst rather than trending cleanly.
Trend & Price Action
The broader structure is sideways, and the slope of the SMA20 at 0.26% over 5 days suggests the short-term trend is only gently rising, not accelerating. That matters: a flat or mildly rising moving average usually points to consolidation, where traders are testing whether the stock deserves a higher range. But HSBC is still below the SMA20, which means the latest price action has not yet confirmed that short-term improvement. At the same time, the SMA50 at 1,485.06 sits just underneath the current price, so the medium-term trend has not broken down. In practical terms, the stock is boxed between two widely watched averages, with the market waiting for one side to give way.
The lack of a fresh MA-cross also matters. A moving-average crossover is often used as a simple trend signal; without one, the chart is telling investors that momentum has not shifted enough to establish a new direction. The shares are also trading close to the lower half of the recent band, with the price near the bottom of the 1,497.20 to 1,597.40 range and only a short distance from the 3-month low of 1,267.20 relative to the 3-month high of 1,610.00. That combination says HSBC has room to recover, but it has not yet shown the strength required to do so.
Oscillators & Momentum
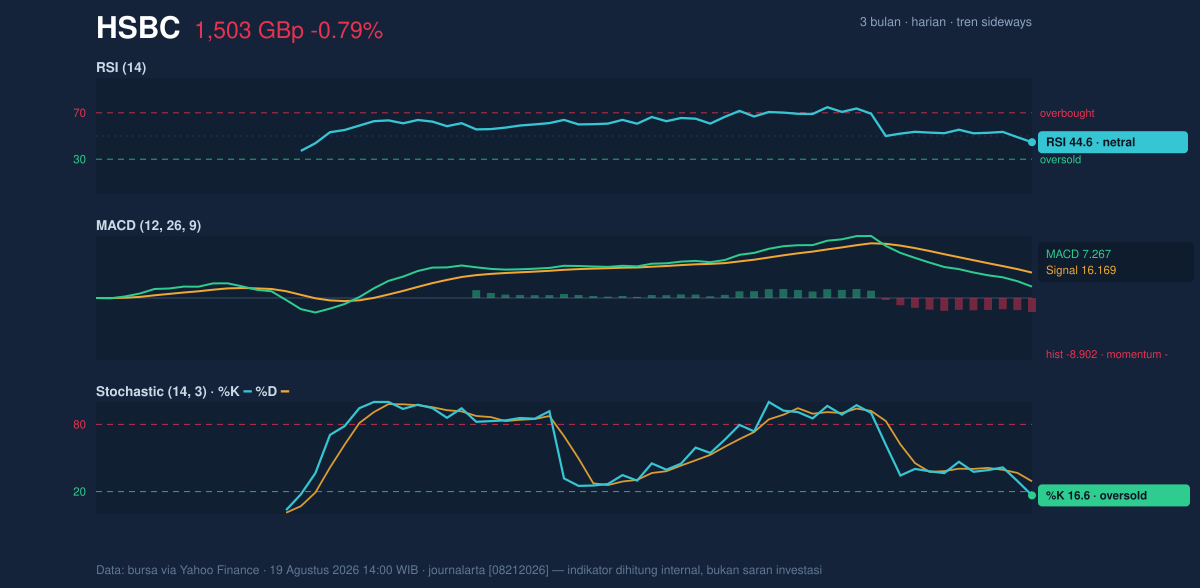
Momentum is mixed, and that is the key tension in this setup. The RSI at 44.6 is neutral, which means the shares are neither stretched on the upside nor deeply washed out. But the Stochastic %K at 16.6 and %D at 29.2 are in oversold territory, suggesting the recent sell-off has gone far enough to pressure short-term traders. That does not guarantee a rebound; it simply means downside momentum may be getting tired. The chart is therefore showing a stock that is weak, but not yet exhausted.
The more important warning comes from MACD. With MACD at 7.267, signal at 16.169 and a histogram of -8.902, the signal line remains above MACD and the histogram is negative, which is a classic sign that downside momentum is still in charge. In plain language, the stock may be oversold on a short-term oscillator, but the broader momentum engine has not turned up. That mismatch often leads to choppy trading rather than an immediate trend reversal.
Volatility & Volume
Volatility is not high, but it is becoming more interesting. The Bollinger band width of 6.9% shows the bands are tightening, a squeeze pattern that often precedes a larger move. The price is also sitting at a very low %B of 14%, meaning it is trading close to the lower Bollinger band at 1,487.90. That usually reflects weak near-term sentiment, but in a squeeze it can also mark the kind of pressure point where a snapback begins if selling dries up. For HSBC, the signal is less about immediate direction and more about stored energy.
Volume adds a useful caution. Last trading volume was 17,200,827, well below the 20-hour average of 28,660,719, or about 0.6× normal. That tells us the latest decline is not being driven by heavy participation. Weak volume on a down move can mean conviction is limited, which reduces the quality of the sell-off. At the same time, OBV is rising, and that is important because on-balance volume tracks whether money flow is quietly accumulating or distributing over time. Rising OBV while price is soft can hint that larger buyers are still present, even if they are not yet pushing the stock higher.
Key Levels & Scenarios
The immediate line in the sand is the 1,497.20 support. If that level holds, the current move can still be read as a shallow pullback inside a broader range. If it fails, the chart risks sliding back toward the lower part of the 3-month range, where sentiment would likely deteriorate further. On the upside, the first meaningful hurdle is the 1,540.90 SMA20, because reclaiming that line would show the stock has recovered its short-term average. Above that, the next checkpoint is the 1,597.40 resistance, which sits close to the upper Bollinger band at 1,593.90. A push through that area would matter because it would suggest the squeeze is resolving to the upside rather than continuing to cap the move.
For now, the chart is telling a simple story: HSBC is not in freefall, but it is still trading under pressure and needs confirmation before the short-term tone improves.
Technical Verdict: HOLD (wait & see)
- Why: MACD remains negative, price is below the SMA20, and the stock is sitting near the lower Bollinger band, which keeps near-term momentum weak.
- Why: Stochastic is oversold and OBV is rising, so downside pressure looks stretched and selling participation is not especially strong.
- Why: Bollinger bands are squeezing, meaning the next move could be sharper once the range resolves, but direction is not yet confirmed.
- Verdict invalidated if price breaks below 1,487.90, the lower Bollinger band and nearby support zone.
- Ideal Entry Range: 1,487.90 to 1,497.20
- Exit Target (Target Price): 1,540.90 to 1,597.40
- Stop Loss protection: below 1,487.90
In plain English: HSBC looks like a stock waiting for proof that the recent weakness has finished.
Next reference level on the chart: 1,487.90.
Summary Data HSBC
| Last price | 1,502.60 GBp |
| Change 1 day / 5 days / 1 month | -0.79% / -2.29% / -2.49% |
| Trend / MA-cross | sideways / none |
| SMA20 / SMA50 | 1,540.90 / 1,485.06 |
| RSI (14) / Stochastic %K | 44.6 / 16.6 |
| Bollinger %B / ATR | 14% / 31.67 |
| Support / Resistance 20 days | 1,497.20 / 1,597.40 |
| Data as of | 19 Agustus 2026 14:00 WIB |
Track HSBC share price daily: live levels, support/resistance and our full HSBC analysis history.