Shell Testing Key Resistance: Stock Gains 1.53% (Agustus 21, 2026)
On Agustus 21, 2026: price 3,440.00 GBp, trend uptrend, RSI 63.7, support 3,234.50, resistance 3,420.50. technical analysis of shell stock.
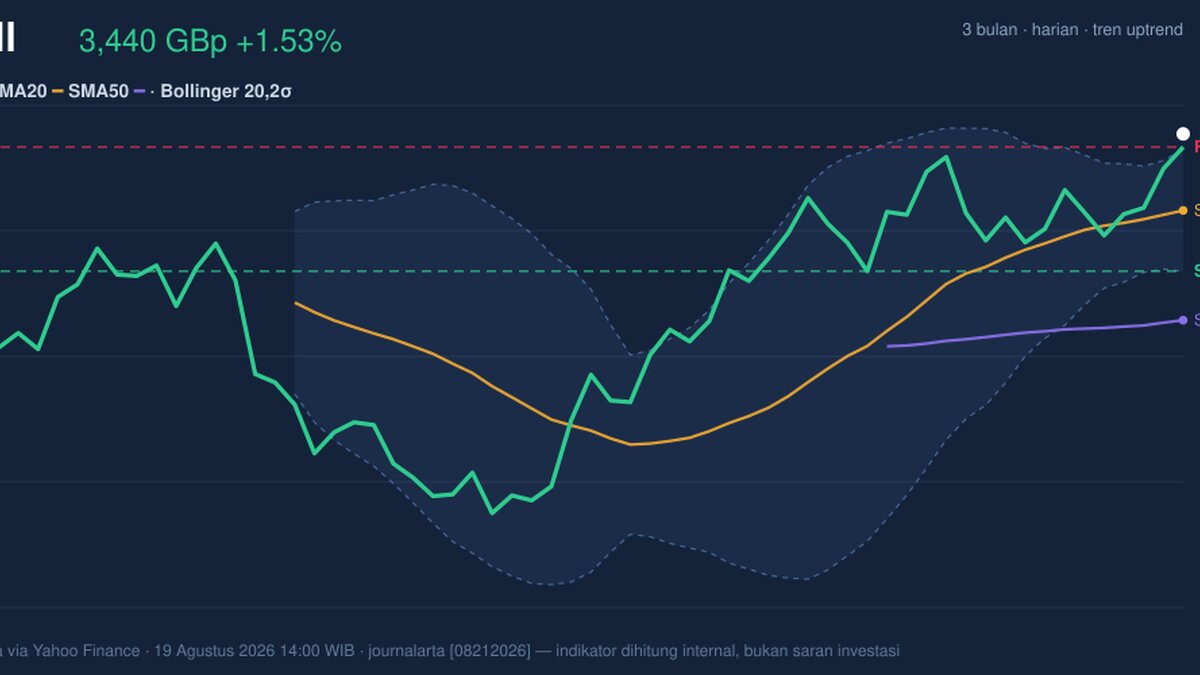
Shell plc shares on the London Stock Exchange rose to 3,440.00 GBp by 19 August 2026 14:00 WIB, extending a short-term advance that has pushed the stock above key moving averages and just beyond the upper Bollinger band, a combination that usually signals strong demand but also a market that may be getting stretched.
Trend & Price Action
The broader structure remains constructive. Shell is in an uptrend, with the price above SMA20 at 3,325.48 and well above SMA50 at 3,161.09, which means recent buyers are still in control and the medium-term trend has not been broken. The slope of the SMA20 at 0.89% over 5 days shows that momentum is not just a one-day spike; it has been building steadily.
That said, the latest move has carried the shares into the upper edge of their recent range. The stock is trading above the 20-hour resistance at 3,420.50 and sits at 110% of the range, which tells readers the price is pressing into territory where follow-through matters more than the initial breakout itself. The 3-month band is still wide, from 2,559.50 to 3,758.50, so there is room for a larger trend, but the immediate test is whether the market can hold its gains rather than just touch them.
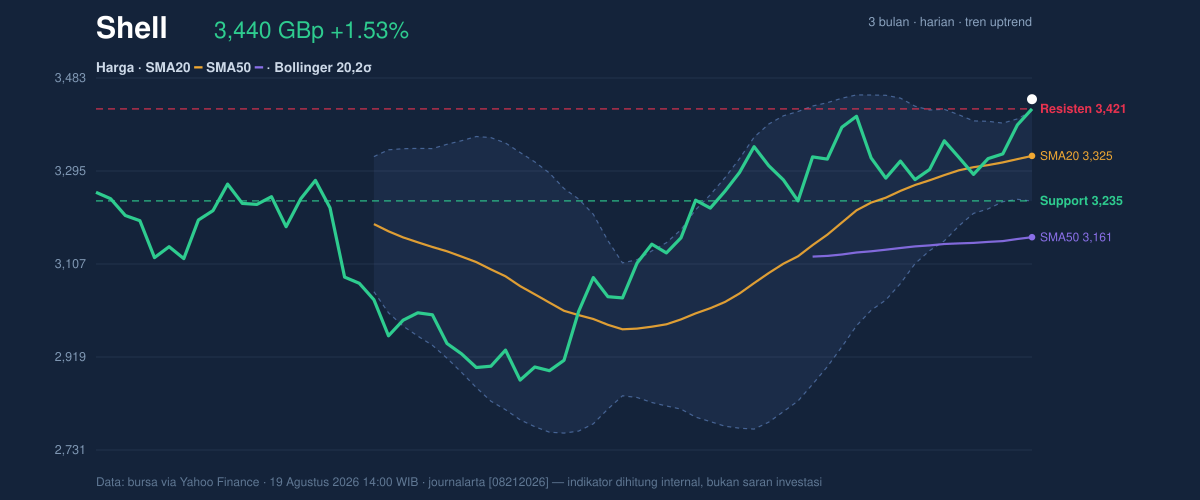
The Bollinger setup reinforces that tension. Shell is trading above the upper Bollinger band at 3,416.82, and the %B reading of 113% means price is not merely near the top of the band but beyond it. In plain English, that often shows enthusiasm has outpaced the average trading envelope. At the same time, the 5.5% band width indicates a squeeze, or narrowing range, which can precede a sharper move. When a squeeze happens while price is already pushing through resistance, the market is effectively warning that the next phase could be more volatile than the last.
Oscillators & Momentum
The momentum picture is mixed, and that is the key signal in this name. The RSI at 63.7 remains in neutral territory, which suggests the stock is not yet in a classic overbought condition on that measure alone. But the Stochastic %K at 97.1 versus %D at 74.3 is firmly overbought, showing the latest price action has moved faster than the underlying trend can comfortably absorb. That difference matters: RSI says the move is still acceptable, while Stochastic says the stock is near the top of its short-term climb and may need to pause or cool.
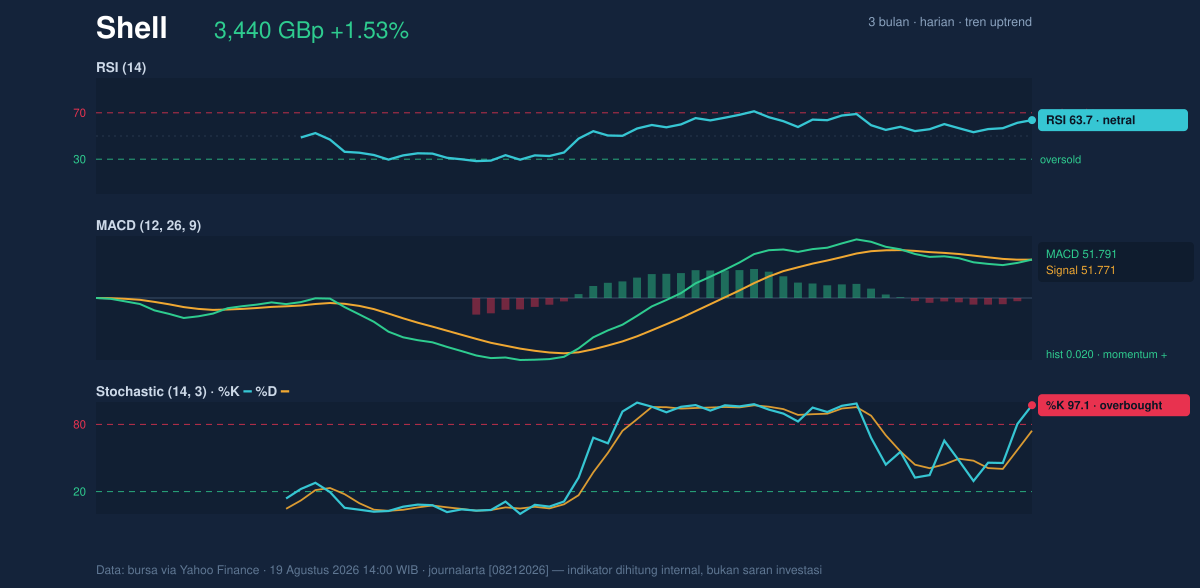
The MACD, meanwhile, is still leaning positive. With MACD at 51.791 just above the signal line at 51.771 and a histogram of 0.020, momentum remains marginally in favor of the bulls, but only just. That tiny spread suggests the trend is positive without being emphatic. In practice, this is the sort of setup that can either turn into a clean continuation if buyers keep showing up, or flatten quickly if the market runs out of immediate catalysts.
Volatility & Volume
Volatility is moderate rather than extreme. The ATR(14) at 67.16, equal to 2.0% of price, indicates the shares can still move decisively in a day, but not in a disorderly way. That matters because Shell is sitting near resistance: a stock with moderate ATR and a squeeze in Bollinger bands can break either direction once a catalyst arrives, and the move may be sharper than recent trading suggests.
Participation is supportive but not euphoric. Last volume was 8,244,034, slightly below the 20-hour average of 8,417,909, or about 1.0× normal. That means the move higher has not yet been backed by a decisive surge in turnover. The OBV is rising, though, which is an important confirmation signal: on-balance volume tracks whether volume is accumulating on up days, and a rising line implies buyers have been more persistent than sellers even if the latest session was not unusually busy.
Shell’s recent performance also fits that pattern. The shares are up 1.53% on the day, 3.54% over 5 days, and 4.50% over 1 month. Those gains are healthy, but they are also the kind of advance that often invites short-term profit-taking if the stock cannot extend beyond nearby resistance with stronger volume.
Key Levels & Scenarios
The immediate technical map is clear. Support at 3,234.50 is the first level that matters if momentum fades, because it sits near the lower end of the recent trading structure and close to the Bollinger middle zone. Below that, the Bollinger midline at 3,325.48 doubles as a trend pivot: staying above it keeps the uptrend intact; losing it would suggest the breakout attempt is losing energy.
On the upside, Resistance at 3,420.50 is now being tested, and the stock is already trading above it. If the shares can hold above that area, the market would be signaling that the upper band break is being accepted rather than rejected. If not, the move risks reverting back toward the upper Bollinger band at 3,416.82 and then the SMA20 at 3,325.48, where buyers would need to defend the trend.
Technical Verdict: HOLD (wait & see)
HOLD (wait & see) reflects a stock that is still trending up, but is also stretched in the short term.
- Reason 1: Price remains above SMA20 at 3,325.48 and SMA50 at 3,161.09, confirming the broader uptrend.
- Reason 2: MACD is positive and OBV is rising, which supports the idea that buyers are still participating.
- Reason 3: Stochastic is overbought and price is above the upper Bollinger band at 3,416.82, so the near-term move looks extended.
- Verdict invalidated if price falls below 3,234.50, because that would break the nearest support and weaken the current trend structure.
- Ideal Entry Range: 3,325.48 to 3,420.50
- Exit Target: 3,420.50 and, if that level holds, the next reference is the upper 3-month range at 3,758.50
- Stop Loss protection: 3,234.50
For non-traders, this means Shell is still moving in the right direction, but it is close enough to short-term limits that the next session needs to prove the strength is real. “We’re still climbing, but the air is getting thinner.”
Summary Data Shell
| Last price | 3,440.00 GBp |
| Change 1 day / 5 days / 1 month | 1.53% / 3.54% / 4.50% |
| Trend / MA-cross | uptrend / none |
| SMA20 / SMA50 | 3,325.48 / 3,161.09 |
| RSI (14) / Stochastic %K | 63.7 / 97.1 |
| Bollinger %B / ATR | 113% / 67.16 |
| Support / Resistance 20 days | 3,234.50 / 3,420.50 |
| Data as of | 19 Agustus 2026 14:00 WIB |
Track Shell share price daily: live levels, support/resistance and our full Shell analysis history.