Testing Key Resistance, Alibaba Stock Drops 0.39% Today
On Agustus 21, 2026: price 126.20 HKD, trend uptrend, RSI 57.2, support 110.00, resistance 128.10. technical analysis of alibaba stock.

Alibaba Group’s Hong Kong-listed shares fell to 126.20 HKD on HKEX, slipping 0.39% from the previous close as the stock held near the upper end of its recent range, according to exchange data on 19 August 2026. The move comes after a strong short-term run: the shares are up 2.94% over 5 days and 11.09% over 1 month, a pattern that says buyers have been willing to pay up for the stock — but not yet in a straight line. The latest price sits above both the SMA20 at 120.41 and the SMA50 at 111.48, which keeps the broader technical posture constructive even as momentum has started to cool.
Trend & Price Action
The chart shows Alibaba still in an uptrend, with the SMA20 rising 1.60% over 5 days. That matters because a rising short-term average usually means the recent rally is still being reinforced by the market’s baseline trend, rather than fading into a one-day bounce. The absence of a fresh MA-cross also matters: there is no new moving-average signal to suggest a major trend shift, so the current setup is more about continuation than a decisive breakout or breakdown.
At the same time, the stock is trading close to the top of its recent trading band. With the latest price at 126.20 HKD versus 20-hour resistance at 128.10, Alibaba is sitting in the upper part of its 90% range. That positioning tells investors the market has already done much of the near-term lifting. It also means any further advance may need fresh buying pressure rather than just trend-following momentum.
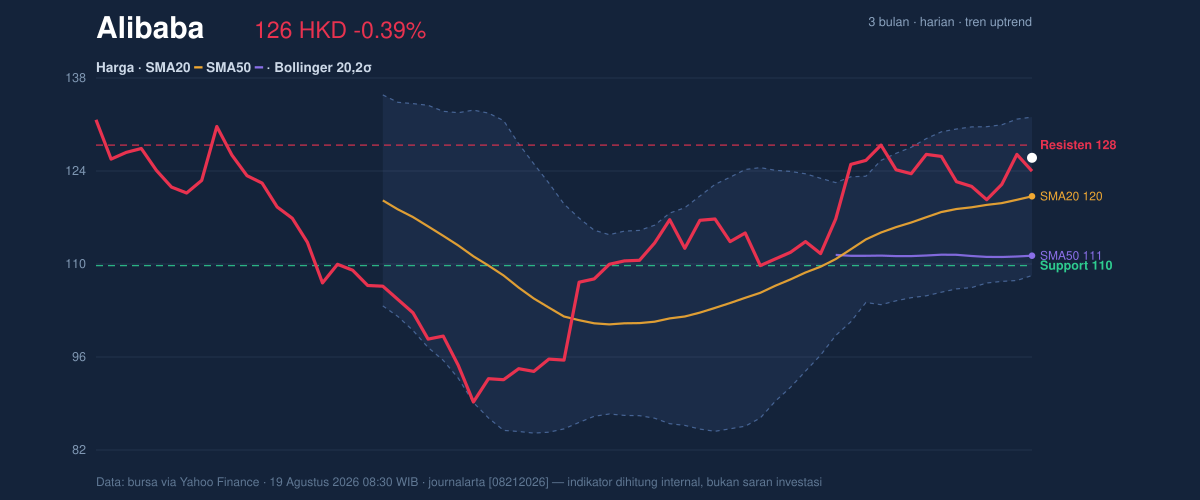
The broader range frames the story clearly: the stock is well above the 3-month low of 88.65, but still below the 3-month high of 135.50. In plain terms, Alibaba has recovered meaningfully, yet it has not fully escaped the zone where prior selling pressure emerged.
A strong trend, but the price is leaning into resistance.
Oscillators & Momentum
The momentum picture is less energetic than the price trend. The RSI at 57.2 is neutral, which signals the stock is neither stretched nor washed out. In other words, the market is not shouting “overbought,” but neither is it offering the kind of oversold setup that often fuels a reflex rebound. The Stochastic %K at 64.1 and %D at 68.5 is also neutral, implying the recent lift has already been digested and is no longer in a strong acceleration phase.
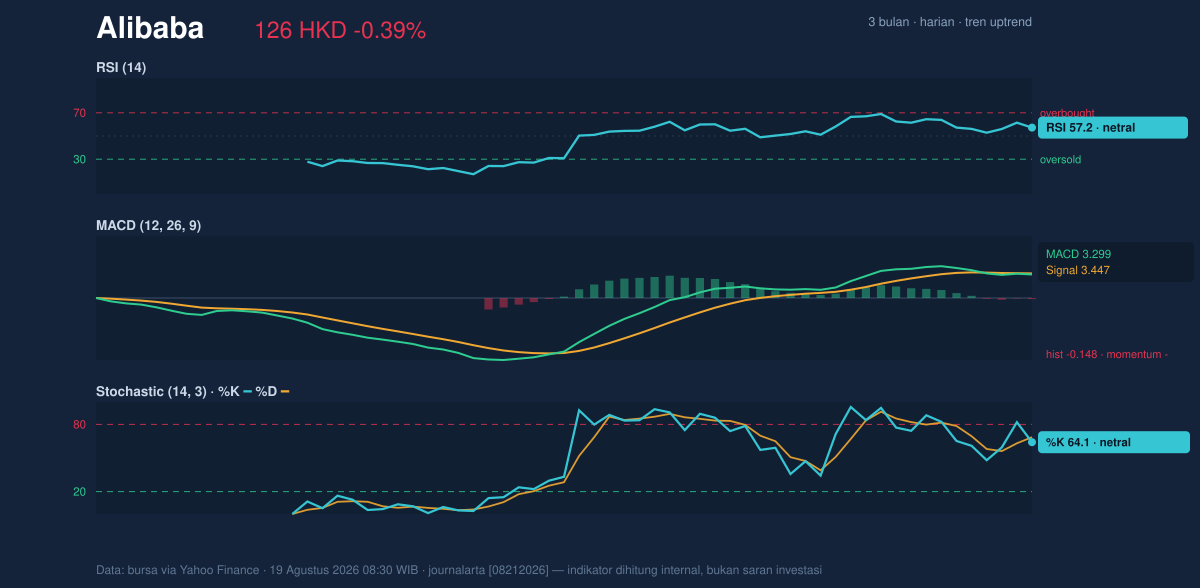
The more cautionary signal comes from MACD. The MACD at 3.299 is still above zero, which usually fits an uptrend, but it sits below the signal line at 3.447 and the histogram at -0.148 is negative. That combination means the trend is still up, but the pace of that move is slowing. For readers unfamiliar with the term, a negative histogram is often the market’s way of saying momentum is lagging the price chart — not a reversal by itself, but a warning that the advance may be losing force.
That divergence between price strength and softer momentum is the key technical tension in the name right now.
Volatility & Volume
Volatility is elevated. The ATR(14) at 4.78, or 3.8% of price, indicates the shares can move materially in a single session. This matters because a stock trading near resistance with high ATR can break either way quickly once it leaves the current congestion zone. The Bollinger Bands add another layer: the upper band is 132.31, the middle band is 120.41, and the lower band is 108.51. The %B at 74% shows price is trading in the upper portion of the band structure, but not at the extreme edge. The 19.8% band width is normal, which suggests this is not a volatility squeeze waiting to explode; instead, the stock is already in a fairly standard volatility regime.
Volume, however, is not confirming the price strength as strongly as one might expect. Last volume was 70,727,616, below the 20-day average of 84,527,715, or about 0.8× normal. That tells us the latest move higher has not been backed by broad participation. The OBV is falling, which is particularly important: on-balance volume tracks whether money is flowing into or out of a stock. A declining OBV while price remains elevated often means buyers are present, but not with enough conviction to fully validate the price advance.
Price is up; participation is not keeping pace.
Key Levels & Scenarios
The immediate technical map is straightforward. Support at 120.41 lines up with the SMA20 and the Bollinger middle band, making it the most important near-term floor. Below that, 108.51 is the lower Bollinger band and a deeper technical support zone. On the upside, 128.10 is the first resistance to clear, followed by 132.31 at the upper Bollinger band. A move through 128.10 would suggest the market is still willing to extend the rally, while failure to hold 120.41 would weaken the short-term trend and increase the odds of a retreat toward 108.51.
The fact that price is already near the top of the recent range means the next move matters more than the last one.
Technical Verdict: HOLD (wait & see)
The technical setup supports a HOLD (wait & see) reading.
- MACD histogram is negative, showing momentum is softer even though the trend remains up.
- Volume is below average and OBV is falling, which weakens confirmation of the recent price rise.
- Price is above SMA20 and SMA50, so the longer-leaning trend remains constructive and prevents a bearish call.
Verdict invalidated if price falls below 120.41, because that would break the short-term trend line and the Bollinger middle band.
- Ideal Entry Range: 120.41 to 122.00 HKD
- Exit Target: 128.10 HKD, with a stretch toward 132.31 HKD
- Stop Loss protection: 108.51 HKD
For non-traders, this means the stock still looks technically healthy, but the latest advance is not yet strong enough to call it fully confirmed.
The 3-month high is 135.50 HKD.
Summary Data Alibaba
| Last price | 126.20 HKD |
| Change 1 day / 5 days / 1 month | -0.39% / 2.94% / 11.09% |
| Trend / MA-cross | uptrend / none |
| SMA20 / SMA50 | 120.41 / 111.48 |
| RSI (14) / Stochastic %K | 57.2 / 64.1 |
| Bollinger %B / ATR | 74% / 4.78 |
| Support / Resistance 20 days | 110.00 / 128.10 |
| Data as of | 19 Agustus 2026 08:30 WIB |
Track Alibaba share price daily: live levels, support/resistance and our full Alibaba analysis history.


