HSBC Stock Drops 1.11% Today, Testing Support Level
On Agustus 21, 2026: price 160.30 HKD, trend sideways, RSI 52.8, support 160.10, resistance 168.20. technical analysis of hsbc stock. HSBC Stock Drops — full…

HSBC Holdings ended at 160.30 HKD on HKEX, down 1.11% from the previous close of 162.10, with the share now sitting just above the 160.10 support area and below its 162.97 20-day average. That positioning matters: it says the stock is not in a clean uptrend, but neither is it breaking down decisively. As shown in the chart, HSBC is trading inside a tightening band, where price compression often comes before a sharper move rather than a quiet drift.
Trend & Price Action
The broader read is still sideways, helped by the fact that the SMA50 at 155.13 remains below price, while the SMA20 at 162.97 sits overhead and acts as a near-term ceiling. In plain terms, the medium-term structure has not turned bearish enough to lose the higher base, but short-term traders are still seeing resistance on rallies. The lack of a fresh MA-cross means the chart has not produced a new trend signal; instead, it is waiting for price to resolve between the shorter average and the lower support band. The 1.8% ATR suggests daily movement is moderate rather than explosive, but that can change quickly when a squeeze is in place.
HSBC is boxed between support and resistance, not trending strongly in either direction.
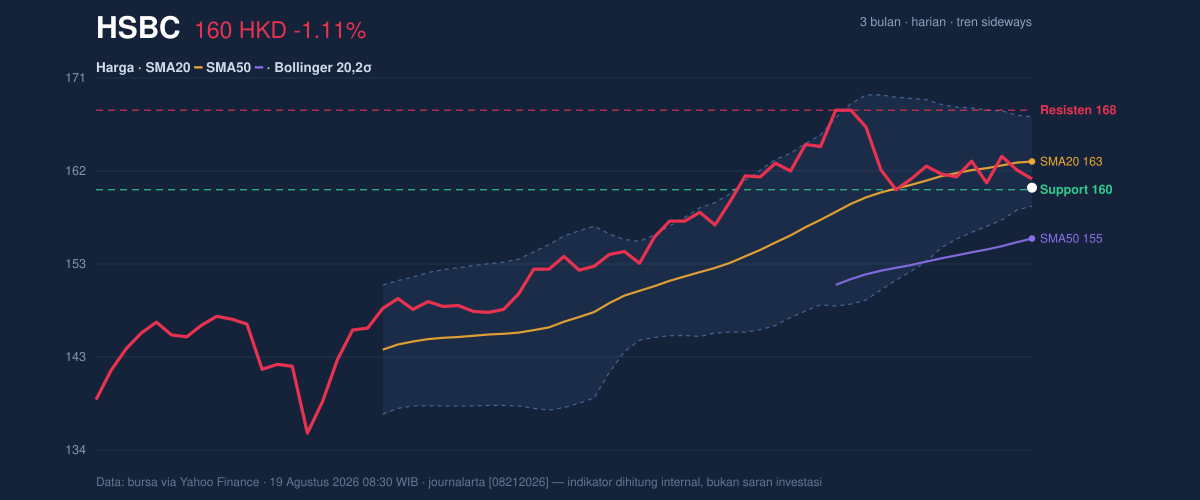
Price is also near the bottom of its recent range: the share is trading only a short distance above 160.10 support and well below 168.20 resistance, while the 3-month high of 169.70 and 3-month low of 133.50 show the stock has already recovered a meaningful amount from the lows without yet reclaiming the upper edge of the range. That is important because a stock in the middle-to-lower part of its range often needs volume to prove a move is real; otherwise, it tends to rotate back toward the center of the band. The 0.88% gain over one month is modest, but the -0.68% move over five days shows the recent tone has softened.
Oscillators & Momentum
Momentum is mixed, which is why the chart does not yet support a decisive directional call. The RSI at 52.8 is neutral, meaning there is no clear overbought or oversold pressure. The Stochastic %K at 30.3 and %D at 39.1 lean soft but remain in neutral territory; this often signals that short-term momentum has cooled without fully resetting into a strong rebound setup. The bigger warning comes from MACD: the MACD at 1.710 sits below the signal line at 2.448, with a -0.738 histogram. In practical terms, that means the faster trend has slipped behind the slower one, a common sign that upward momentum is fading even if price has not yet broken support.
RSI is neutral, Stochastic is soft, and MACD is negative — momentum is not yet confirming a breakout.
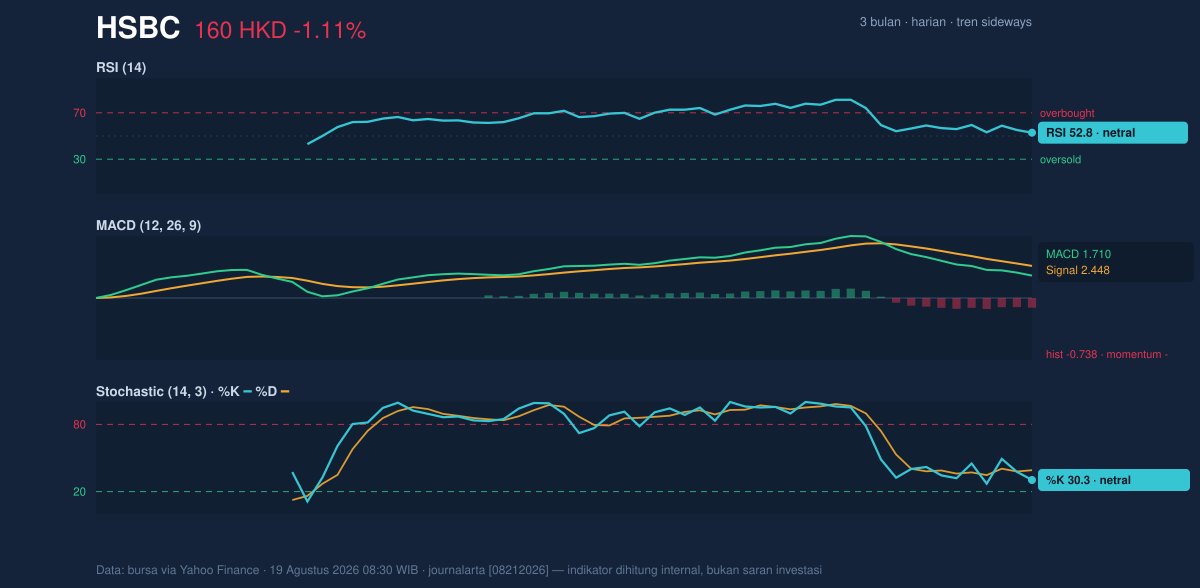
This combination matters because it explains why the stock can hold a range even while momentum weakens: the market is not aggressively selling, but buyers are also not strong enough to push through overhead supply. The result is a waiting pattern, where the next move will likely depend on whether momentum turns up from neutral or rolls further lower from here.
Volatility & Volume
Volatility is compressing. The Bollinger Band width of 5.6% is narrow, and the chart description of a squeeze signals that the stock may be storing energy for a larger move. The %B at 21% shows price is hugging the lower part of the band, which usually means the market is closer to the lower edge of its recent statistical range than the upper edge. That does not automatically mean a bounce, but it does tell readers that the stock is not stretched upward. When a squeeze appears with price near the lower band, the market is often waiting for a catalyst to decide whether the next move is a rebound toward the middle band or a break beneath support.
Volume, however, is not yet confirming urgency. Last volume was 8,430,459, below the 13,410,114 20-day average, or about 0.6× normal. That is a sign of limited participation, which weakens the credibility of recent price swings. The OBV is falling, and that is a subtle but meaningful signal: on-balance volume tracks whether money is accumulating or leaving the stock over time, and a decline suggests distribution pressure is outweighing accumulation even if the price has not fully reflected it yet.
The Bollinger squeeze points to a coming move, but low volume and falling OBV make the current drift look fragile.
Key Levels & Scenarios
The first level to watch is 160.10 support. If that floor gives way, the chart would likely test whether the lower Bollinger band at 158.42 can contain the move; failing that, the 155.13 SMA50 becomes the next structural reference. On the upside, the immediate hurdle is 162.97, the 20-day average and Bollinger midline, because reclaiming it would show the stock has moved back into the center of its range. Above that, 167.52 is the upper Bollinger band, with 168.20 resistance just above it; a move through both would suggest the squeeze is resolving higher rather than fading back into the band.
Support is 160.10, resistance is 168.20, and the 162.97 mid-band is the pivot that decides whether the stock can recover its short-term trend.
Technical Verdict: HOLD (wait & see)
HOLD (wait & see) fits best because the chart is balanced between a still-intact medium-term base and a weak short-term momentum profile. The RSI at 52.8 is neutral, the Stochastic reading is soft but not oversold, and the MACD remains below its signal line, so there is no clean momentum confirmation. At the same time, the stock is still above the 155.13 SMA50 and inside a 5.6% Bollinger squeeze, which means the setup is unresolved rather than broken.
- Ideal Entry Range: 160.10 to 162.97, where support and the 20-day average define the current decision zone.
- Exit Target (Target Price): 167.52 to 168.20, where the upper Bollinger band and resistance cluster sit.
- Stop Loss protection: below 158.42, with 155.13 as the deeper structural line.
This setup is invalidated if price breaks below 160.10 and fails to recover, because that would hand control back to sellers.
For non-traders: HSBC is still holding its base, but the chart needs a clearer push above the middle band before the next move looks convincing.
Next key level: 160.10 HKD support.
Summary Data HSBC
| Last price | 160.30 HKD |
| Change 1 day / 5 days / 1 month | -1.11% / -0.68% / 0.88% |
| Trend / MA-cross | sideways / none |
| SMA20 / SMA50 | 162.97 / 155.13 |
| RSI (14) / Stochastic %K | 52.8 / 30.3 |
| Bollinger %B / ATR | 21% / 2.81 |
| Support / Resistance 20 days | 160.10 / 168.20 |
| Data as of | 19 Agustus 2026 08:30 WIB |
Track HSBC share price daily: live levels, support/resistance and our full HSBC analysis history.



