OCBC Stock Technicals Today: Drops 0.55%, Momentum Gains
On Agustus 21, 2026: price 30.78 SGD, trend uptrend, RSI 66.0, support 28.63, resistance 31.79. technical analysis of ocbc stock. OCBC Stock Technicals — full…

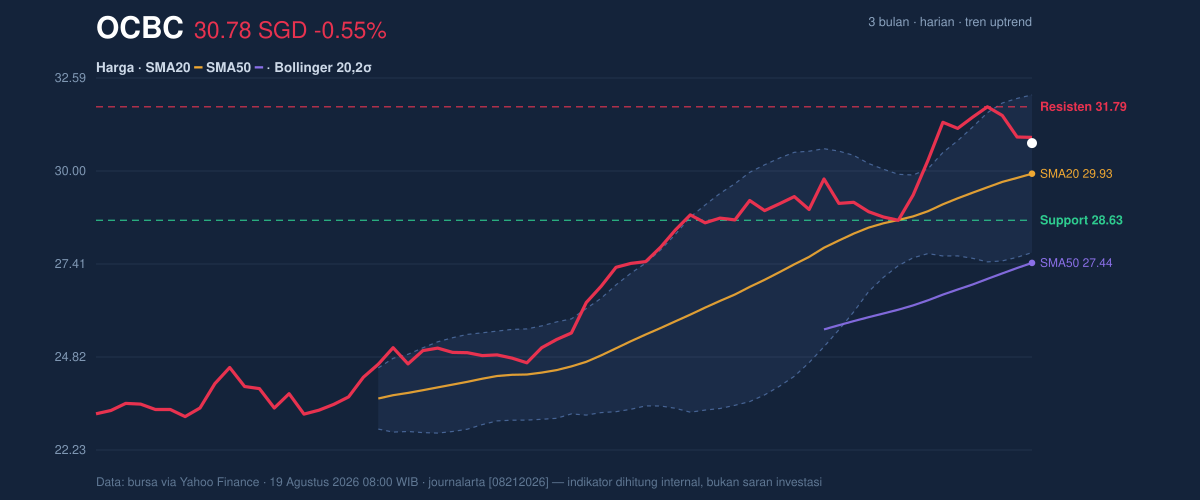
OCBC Bank’s shares on the SGX slipped 0.55% to SGD 30.78 as of 19 August 2026, but the move sits inside a broader advance rather than a breakdown. The stock is still trading above its SMA20 at 29.93 and well above SMA50 at 27.44, which tells traders the medium-term trend remains constructive even after the latest pullback. As shown in the chart, the price is holding in the upper half of its recent range, a sign that sellers have not yet forced a change in structure.
Trend & Price Action
The most important signal here is that OCBC remains in an uptrend, with the SMA20 rising at 2.34% over five days. That slope matters because it shows the average price itself is moving higher, not just the spot price bouncing around it. In plain terms, the market is still willing to pay up for the shares on dips.
The stock’s latest close is also only a little below the recent ceiling. The 20-hour resistance at 31.79 sits close to the 3-month high of 31.86, which means the chart is pressing into a zone where prior buying interest has already started to fade. That does not signal weakness by itself; it signals that the next leg higher would need fresh demand, not just momentum carryover.
At the same time, the 20-hour support at 28.63 is comfortably below the current price, and the shares are positioned at 68% of the range. That placement usually implies the market is leaning bullish, but not so stretched that every small dip becomes a trend change. The recent one-day and five-day declines mainly look like digestion after a stronger 1-month gain of 7.47%.
Oscillators & Momentum
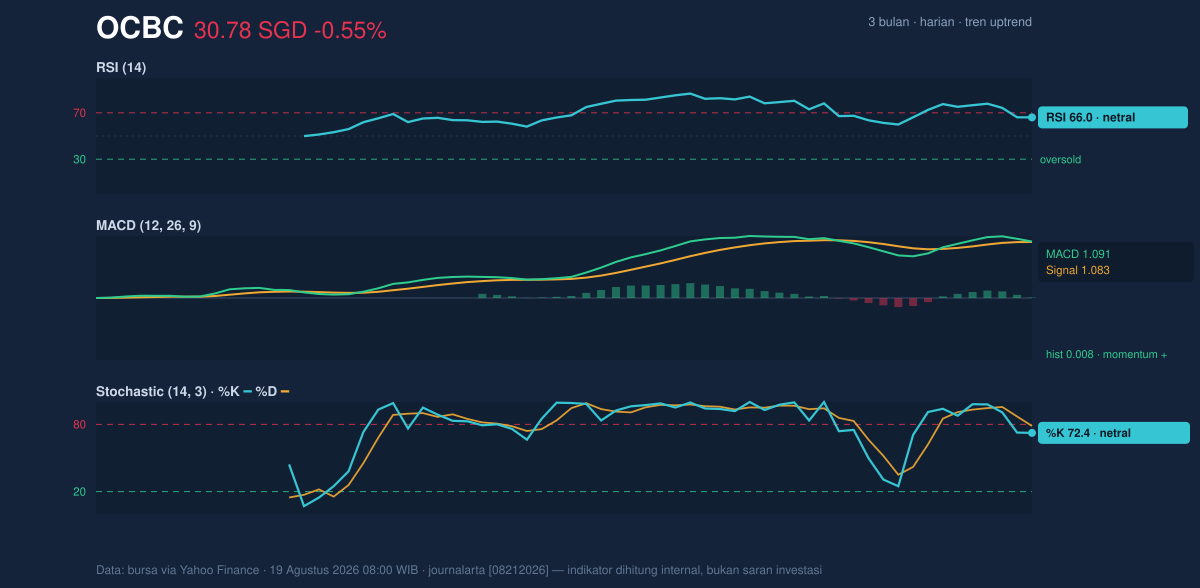
The momentum picture is supportive, but not explosive. The RSI at 66.0 is described as neutral, yet it sits close to the upper end of the band where strength is visible without being overheated. That matters because RSI in this zone often says the trend is healthy, but it also warns that upside may need consolidation before extending further.
The Stochastic reading of 72.4 / 78.6 is also neutral, though the faster line is below the slower one. That setup suggests momentum is still firm, but the short-term push has cooled enough that the market may be pausing rather than accelerating. In other words, the oscillator is not flashing a reversal, but it is no longer shouting for immediate upside either.
The clearest confirmation comes from MACD at 1.091 versus its signal at 1.083, with a small positive histogram of 0.008. That narrow spread says bullish momentum is still intact, but only just. It is a subtle signal: buyers remain in control, yet the edge is modest, so any new breakout would need volume support to avoid a false move.
Volatility & Volume
Volatility is moderate rather than elevated. The ATR(14) at 0.70, equal to 2.3% of price, suggests daily swings are present but not disorderly. That usually suits a stock in consolidation near highs: the market can move, but it is not behaving like a stress event or a capitulation phase.
Bollinger Bands reinforce that reading. Price sits between the middle band at 29.93 and the upper band at 32.12, with %B at 69%. That means the shares are trading above the midpoint of the band structure and closer to the top than the bottom, a classic sign of upward bias. The 14.7% band width is normal, so this is not a squeeze that usually precedes a dramatic breakout, nor is it a wide expansion that often accompanies panic. It is a steady market, not a dramatic one.
Volume, however, is softer than ideal. The latest turnover of 6,133,600 is only 0.9× the 20-hour average of 7,183,863, which means the recent price action has not been backed by above-normal participation. That is important because a stock sitting near resistance often needs stronger volume to prove that buyers are serious. The positive clue is that OBV is rising, indicating cumulative demand has still been improving even if the latest session was not especially busy.
Key Levels & Scenarios
The chart sets up a fairly clean tactical map. The first level to watch is 31.79, where price is approaching resistance just under the 3-month high of 31.86. A move through that area would show the market is willing to absorb supply at the top of the range. If that fails, the shares may remain trapped in a sideways band despite the broader uptrend.
On the downside, 29.93 is the key pivot because it is both the SMA20 and the middle Bollinger band. Losing that area would not automatically break the trend, but it would weaken the message that buyers are defending the short-term average. Below that, 28.63 becomes the more important support, and a fall through it would suggest the current uptrend is losing structure.
Technical Verdict: HOLD (wait & see)
HOLD (wait & see) is the clearest technical read because OCBC is still in an uptrend, but it is also testing resistance with only modest momentum and below-average volume.
- Reason 1: Trend remains positive — price is above SMA20 at 29.93 and SMA50 at 27.44, with no fresh bearish MA-cross.
- Reason 2: Momentum is constructive but not decisive — MACD is slightly above signal, while RSI 66.0 and Stochastic 72.4 / 78.6 show strength without a breakout confirmation.
- Reason 3: Price is near resistance — 31.79 is close to the 3-month high of 31.86, but volume is only 0.9× average, so follow-through is not yet convincing.
- Verdict invalidated if price breaks below 28.63, which would mean the nearest support has failed and the short-term structure is no longer holding.
- Ideal entry range: 29.93 to 28.63
- Exit target: 31.79 to 31.86
- Stop loss protection: below 28.63
In plain English: the shares still look firm, but they need a cleaner break above resistance before the chart shows stronger conviction.
Summary Data OCBC
| Last price | 30.78 SGD |
| Change 1 day / 5 days / 1 month | -0.55% / -1.31% / 7.47% |
| Trend / MA-cross | uptrend / none |
| SMA20 / SMA50 | 29.93 / 27.44 |
| RSI (14) / Stochastic %K | 66.0 / 72.4 |
| Bollinger %B / ATR | 69% / 0.70 |
| Support / Resistance 20 days | 28.63 / 31.79 |
| Data as of | 19 Agustus 2026 08:00 WIB |
Track OCBC share price daily: live levels, support/resistance and our full OCBC analysis history.

