Tencent Stock Gains 2.03%, Momentum Weakens In Focus
On Agustus 21, 2026: price 451.40 HKD, trend sideways, RSI 44.4, support 434.60, resistance 492.20. technical analysis of tencent stock.

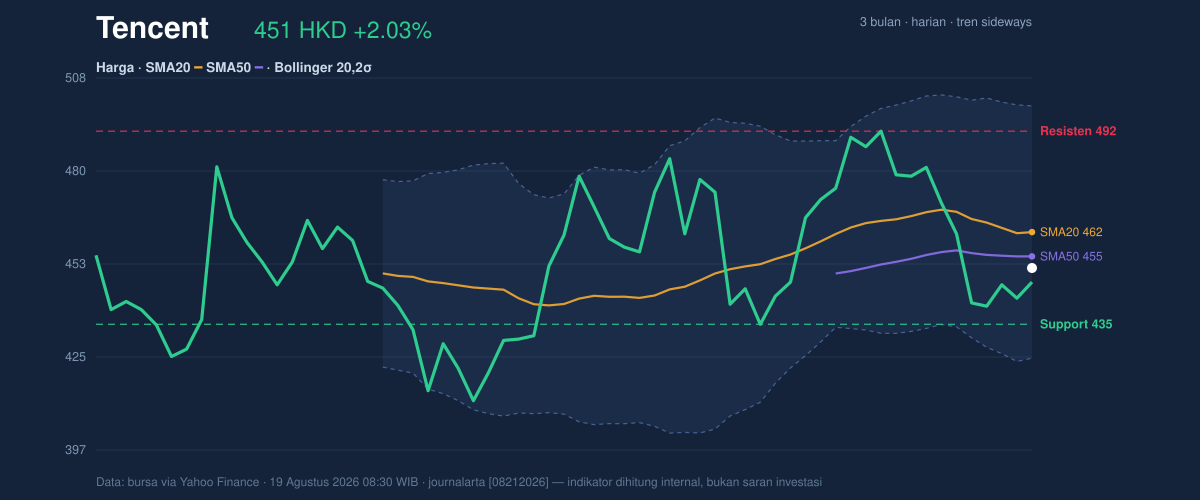
Tencent Holdings slipped to HKD 451.40 on HKEX in Hong Kong on 19 August 2026, rising 2.03% from the previous close but still trading below its short-term trend lines, a setup that says the rebound has not yet fully repaired the recent weakness. The move matters less as a one-day bounce than as a test of whether buyers can reclaim control after a 5-day decline of 2.21% and a price position that remains under the SMA20 at HKD 462.12 and just under the SMA50 at HKD 454.87. In plain terms: Tencent is not in freefall, but it is still trying to prove that the latest uptick is more than a pause in a sideways market.
Trend & Price Action
The chart shows a stock that is still range-bound rather than trending decisively. Tencent is sitting in a sideways structure, with the SMA20 slope down 1.29% over 5 days, which signals that the near-term drift remains lower even though the broader picture is not broken. Price is also below the SMA20, while the lack of a new MA-cross means the moving averages have not delivered a fresh bullish or bearish signal. That matters because a crossover often marks a shift in market leadership; without one, traders are left with a market that is still waiting for confirmation.
The current price is also near the lower half of its recent band: it sits at 29% of the 20-hour range, with support at HKD 434.60 and resistance at HKD 492.20. The 3-month range adds context: Tencent is well above the 3-month low of HKD 411.00, but still below the 3-month high of HKD 497.80, which shows the stock has room to recover if momentum improves, yet remains capped by overhead supply. As shown in the chart, the price is trying to lift off the lower part of the Bollinger envelope, but it has not reached the middle band at HKD 462.12.
That is the key signal: the stock is bouncing, but not yet escaping.
Oscillators & Momentum
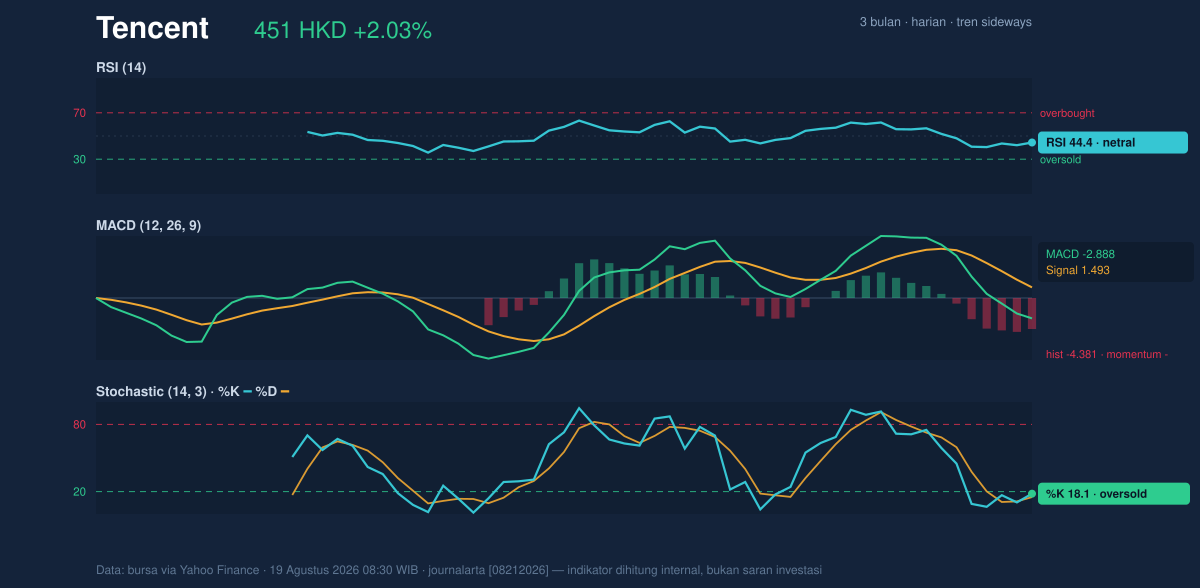
The momentum picture is mixed, and that mix explains why the price has not broken out. The RSI at 44.4 is neutral, which means Tencent is neither overbought nor oversold on this measure. In contrast, the Stochastic %K at 18.1 and %D at 15.1 are both in oversold territory, hinting that short-term selling pressure may be stretched. This is often where rebounds begin, but oversold does not mean reversal by itself; it only means the stock is vulnerable to a bounce if buyers step in.
The bigger caution comes from the trend-confirmation tools. The MACD at -2.888, below its signal line at 1.493, with a histogram of -4.381, shows momentum is still negative. In practical terms, the stock’s short-term price action is lagging the longer-term trend, so any rebound needs to overcome active downward pressure rather than just the absence of selling. As shown in the momentum chart, the oscillators are not aligned: Stochastic is flashing near-term exhaustion, while MACD still says the tape is weak.
That split is why the move feels tentative rather than decisive.
Volatility & Volume
Volatility is present, but not extreme. The ATR(14) at 12.97, equal to 2.9% of price, suggests Tencent can still move meaningfully in either direction without looking disorderly. Meanwhile, the Bollinger Band width of 16.3% is described as normal, so this is not a squeeze waiting for a dramatic expansion, nor is it a panic-style widening. Price is at %B 36%, meaning it is trading in the lower part of the band rather than near the upper boundary. That positioning usually tells you the market is not overextended, but it also says buyers have not yet forced a convincing re-rating.
Volume reinforces that caution. The latest volume of 19,773,887 is only 0.7x normal versus the 20-hour average of 26,367,834, and OBV is falling. Lower-than-average participation during a rebound often means the move lacks conviction; falling OBV suggests that, on balance, trading flow has been more consistent with distribution than accumulation. In other words, the stock can rise on a quiet session, but quiet sessions do not always build durable trends.
The market is listening, but not fully committing.
Key Levels & Scenarios
The most important levels are clear from the chart. HKD 434.60 is the first support to watch, while HKD 492.20 is the near-term resistance that has to be cleared before the price can challenge the upper Bollinger area at HKD 499.75. The middle Bollinger band at HKD 462.12 also matters because it overlaps with SMA20; reclaiming that zone would suggest the stock is moving from a weak range position back toward the center of its trading band.
If Tencent holds above HKD 434.60 and pushes through HKD 462.12, the chart would start to look less fragile, especially if momentum improves from oversold Stochastic levels. If it fails to hold HKD 434.60, the lower part of the recent range opens up again, and the market would be forced to reassess whether the bounce was only a short-covering move.
Technical Verdict: HOLD (wait & see)
HOLD (wait & see) fits the chart best because the stock is rebounding, but the trend is still sideways, price remains below the SMA20, and MACD is negative even as Stochastic turns oversold.
Reasons:
- RSI 44.4 is neutral, so there is no strong momentum confirmation either way.
- Stochastic 18.1 / 15.1 is oversold, which supports a bounce, but not a confirmed reversal.
- MACD -2.888 and OBV down argue that underlying momentum and participation are still weak.
Verdict invalidated if price breaks below HKD 434.60.
- Ideal Entry Range: HKD 434.60 to HKD 462.12
- Exit Target (Target Price): HKD 492.20 to HKD 499.75
- Stop Loss protection: below HKD 434.60
For non-traders, this means Tencent is trying to stabilize, but the market has not yet shown enough strength to call the rebound durable.
“The stock is not out of trouble yet, and the next move matters more than the last one.”
Summary Data Tencent
| Last price | 451.40 HKD |
| Change 1 day / 5 days / 1 month | 2.03% / -2.21% / 2.45% |
| Trend / MA-cross | sideways / none |
| SMA20 / SMA50 | 462.12 / 454.87 |
| RSI (14) / Stochastic %K | 44.4 / 18.1 |
| Bollinger %B / ATR | 36% / 12.97 |
| Support / Resistance 20 days | 434.60 / 492.20 |
| Data as of | 19 Agustus 2026 08:30 WIB |
Track Tencent share price daily: live levels, support/resistance and our full Tencent analysis history.


