Tencent Stock Drops 0.99%, Death Cross Pressure In Focus
On September 8, 2026: price 438.40 HKD, trend downtrend, RSI 43.6, support 433.00, resistance 470.80. technical analysis of tencent stock.

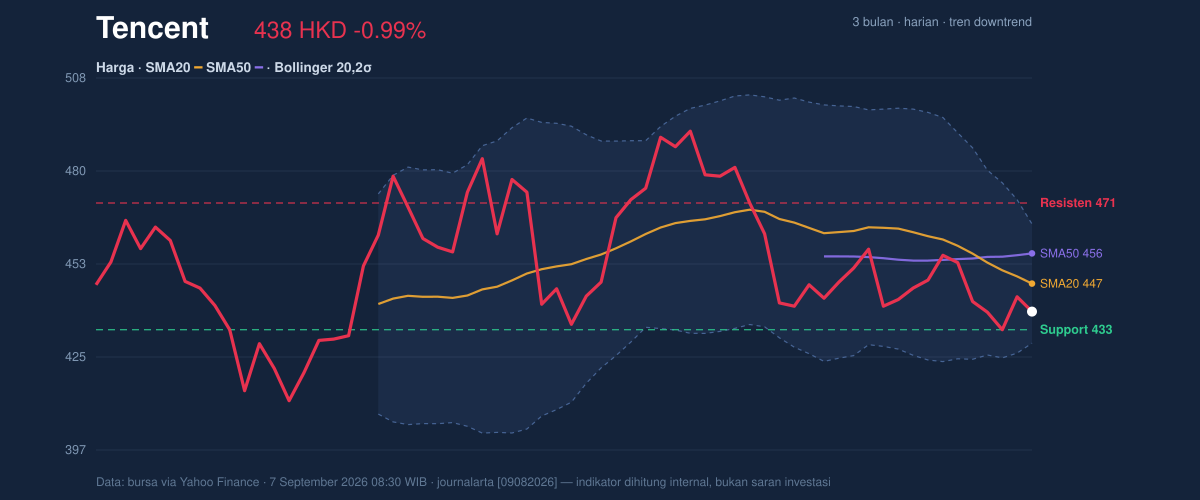
Tencent Holdings slipped on the Hong Kong stock exchange on 7 September 2026, with 0700.HK last changing hands at HKD 438.40, down from a previous close of 442.80, as the chart showed the shares sitting below key trend markers and still under pressure after a month-long decline.
The move matters because the market is not just reacting to one weak session. Tencent is now trading below the SMA20 at 446.75 and below the SMA50 at 455.74, with the short-term average itself sloping down at -2.46% over 5 days. That combination is usually read as a market that is still selling rallies rather than rewarding them. The death cross — where the 20-day average has moved below the 50-day average — reinforces that message: momentum has deteriorated enough to pull the faster trend under the slower one, a classic sign that buyers have lost control of the tape. The stock is also down 8.93% over 1 month, and its position at 14% of the 20-hour range shows it is closer to support than resistance, but not yet in a clear rebound zone.
The chart is still pointing lower, but the market is also compressing.
Trend & Price Action
As shown in the chart, Tencent is trading between support at 433.00 and resistance at 470.80, with the latest price just above the lower end of that band. That placement is important: it tells readers the stock is not collapsing, but it is also not reclaiming the levels that would suggest renewed confidence. The broader three-month range adds context. Tencent’s 3-month high is 497.80 and 3-month low is 411.00, so the current price is much nearer the low than the high. In technical terms, that usually means the market is still working through a corrective phase rather than building a fresh uptrend.
The Bollinger structure adds a second layer to that picture. The middle band at 446.75 sits above the latest price, while the lower band at 428.97 is only a little below it. Price near the lower band often signals weakness, but it can also mean the market is testing whether sellers are exhausted. The notable detail here is the 8.0% band width, which suggests a squeeze. Squeezes do not predict direction on their own; they mean volatility has contracted and the next meaningful move could be sharper once the stock escapes the band. In plain English: Tencent is being squeezed, and compressed price action often precedes a more decisive move.
Oscillators & Momentum
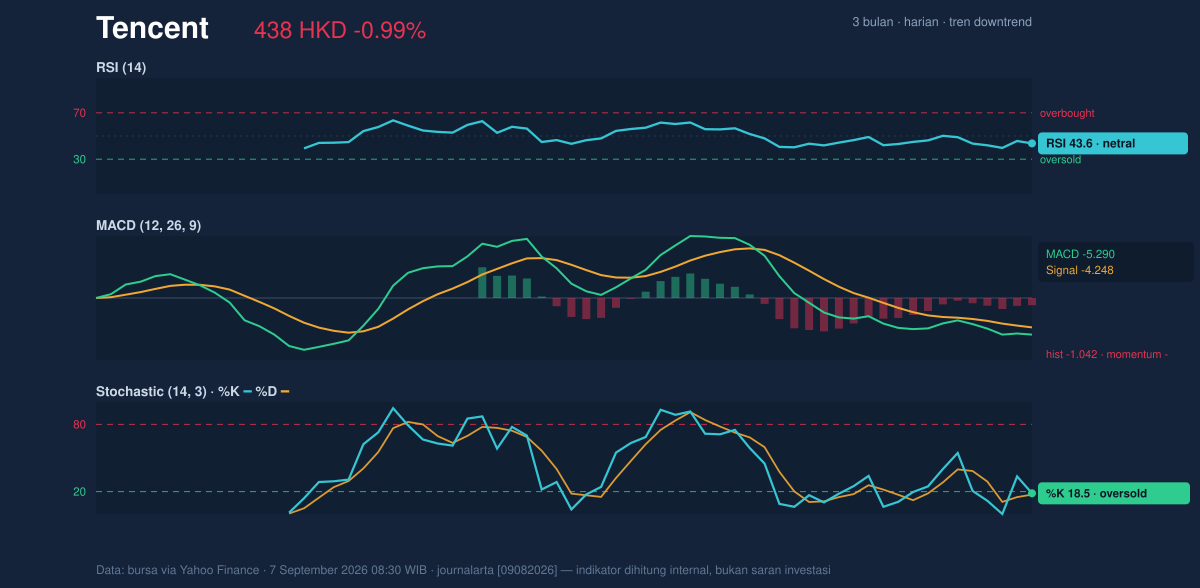
The momentum tools are mixed, but not in a way that strongly favors a rebound yet. The RSI at 43.6 is neutral, which means the stock is neither overbought nor deeply oversold. That matters because neutral RSI in a downtrend often implies the decline has room to continue unless another catalyst changes the tone. By contrast, the Stochastic %K at 18.5 and %D at 17.4 are in oversold territory, which can hint that selling is stretched in the very short term. But oversold does not mean reversal; it means the stock is vulnerable to a bounce if buyers appear.
The more cautionary signal comes from MACD. Tencent’s MACD at -5.290 remains below the signal line at -4.248, with a histogram of -1.042. That combination indicates negative momentum is still intact, and the gap between MACD and signal line suggests the downtrend has not yet fully exhausted itself. In other words, the oscillators are not aligned: Stochastic is flashing short-term exhaustion, but MACD still says the broader momentum is bearish.
Oversold does not cancel a downtrend when MACD is still negative.
Volatility & Volume
Tencent’s ATR(14) of 10.91, equal to 2.5% of price, points to moderate volatility. That tells traders the stock is moving enough to matter, but not in a panic-like fashion. Combined with the Bollinger squeeze, it suggests the current calm could be temporary. The next move may be more forceful than recent sessions, even if the daily range itself has not yet widened dramatically.
Volume, however, is soft. The latest turnover of 10,442,987 shares is only 0.5× the 20-session average of 22,934,051. That matters because declines on light volume are often less convincing than declines on heavy participation. At the same time, OBV is rising, which is a subtle but important counter-signal. On-balance volume tracks whether volume is flowing into or out of a stock; a rising OBV while price is weak can mean accumulation is quietly happening beneath the surface. So the tape is not uniformly bearish — it is weak, but not obviously panicked.
Key Levels & Scenarios
The immediate decision points are clear. Support at 433.00 is the first line to watch, while 428.97 — the lower Bollinger band — marks a nearby technical cushion. If Tencent can hold above that area and reclaim the 446.75 middle band, the chart would begin to look less fragile. On the upside, 470.80 resistance is the first major barrier; a move back toward that zone would show the market is willing to revisit the upper half of the recent range. Failure to defend 433.00 would leave the stock exposed to a retest of the 411.00 three-month low.
Technical Verdict: HOLD (wait & see)
- Verdict: HOLD (wait & see)
- Reason 1: The death cross and price below both SMA20 and SMA50 keep the trend negative.
- Reason 2: MACD remains negative, which says downside momentum has not fully faded.
- Reason 3: Stochastic is oversold and OBV is rising, so there is evidence of short-term exhaustion and possible quiet accumulation.
- Verdict invalidated if price breaks below 428.97, because that would mean the lower Bollinger band and nearby support failed to contain the move.
- Ideal Entry Range: 428.97 to 433.00
- Exit Target: 446.75, then 470.80
- Stop Loss protection: below 428.97, with deeper risk if 411.00 gives way
For non-traders, this means Tencent is weak but not broken, and the market is waiting for proof that the selling pressure has truly stopped.
“It feels like the stock is catching its breath — but if 433 does not hold, the pressure could come back fast.”
Summary Data Tencent
| Last price | 438.40 HKD |
| Change 1 day / 5 days / 1 month | -0.99% / -3.22% / -8.93% |
| Trend / MA-cross | downtrend / death |
| SMA20 / SMA50 | 446.75 / 455.74 |
| RSI (14) / Stochastic %K | 43.6 / 18.5 |
| Bollinger %B / ATR | 27% / 10.91 |
| Support / Resistance 20 days | 433.00 / 470.80 |
| Data as of | 7 September 2026 08:30 WIB |


