Singtel Momentum Gains: Stock Gains 0.23% (Agustus 21, 2026)
On Agustus 21, 2026: price 4.45 SGD, trend sideways, RSI 51.0, support 4.25, resistance 4.61. technical analysis of singtel stock. Singtel Momentum Gains —…

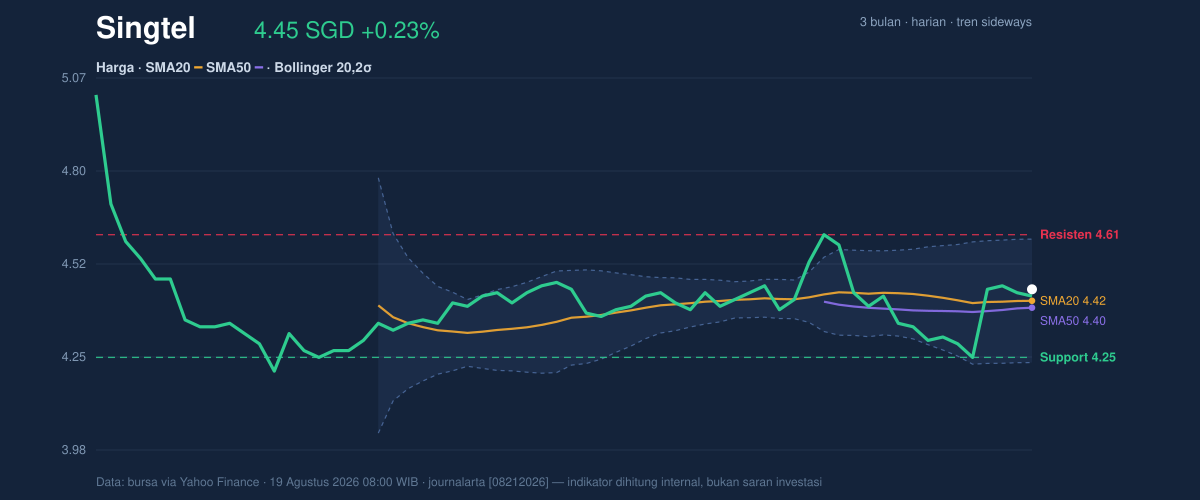
Singapore Telecommunications Ltd. (Singtel) edged up to SGD 4.45 on SGX, a modest gain from SGD 4.44 that keeps the stock in a narrow, data-driven holding pattern rather than a clear breakout. The move sits inside a broader sideways trend, and as shown in the chart, the market is still deciding whether recent firmness above the short-term average is the start of a more durable advance or just another pause within range trading.
Trend & Price Action
The most important signal is that Singtel is now trading above SMA20 at SGD 4.42 and above SMA50 at SGD 4.40, which tells traders the price has recovered enough to sit on the constructive side of both short- and medium-term trend markers. That matters because when price holds above both averages, it usually means sellers have lost some urgency, even if the broader trend has not yet turned decisively upward.
There is still no fresh MA-cross, so the chart does not yet show a clean trend reversal signal. The SMA20 slope of -0.03% over 5 days also says the short-term trend is only flattening, not accelerating higher. In plain language, the stock is stabilising rather than breaking out.
The position within the recent range is also informative. With support at SGD 4.25 and resistance at SGD 4.61, the last price sits at about 56% of the range, which is slightly above the midpoint. That placement suggests buyers have regained some control, but not enough to challenge the upper boundary with conviction. The stock is still well below the 3-month high of SGD 5.05 and above the 3-month low of SGD 4.15, reinforcing the idea of recovery inside a broader consolidation.
Oscillators & Momentum
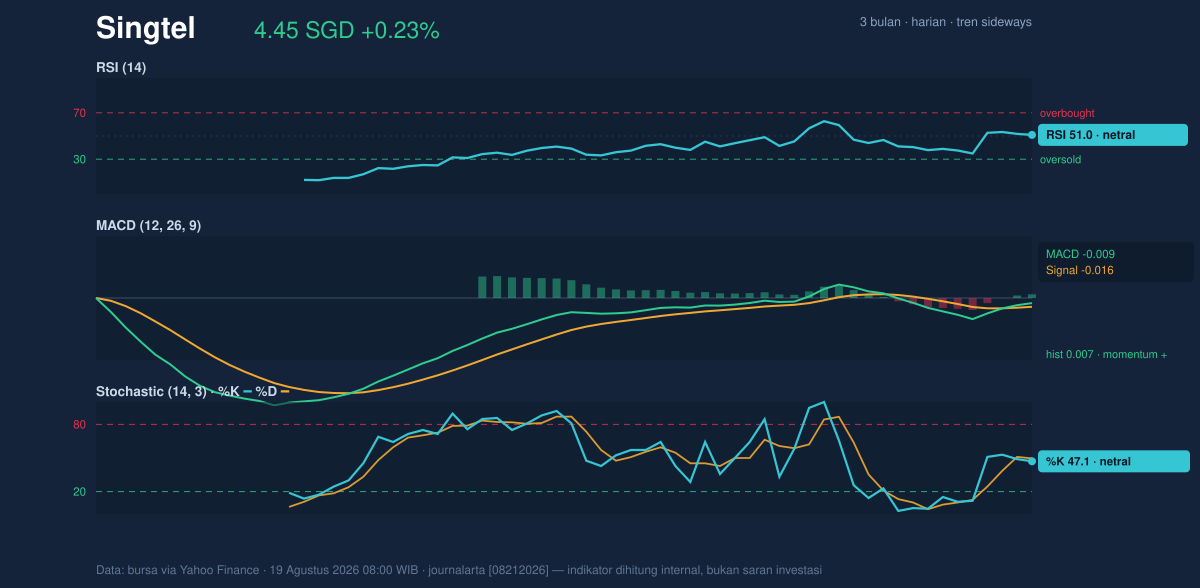
Momentum indicators are mostly neutral, but not weak. The RSI(14) at 51.0 is essentially balanced, which means the stock is neither overbought nor oversold. That is important because a neutral RSI near the midline often accompanies range-bound trading and leaves room for either direction without immediate exhaustion.
The Stochastic %K at 47.1 and %D at 49.7 also sit in neutral territory. This tells us the latest bounce has not yet become stretched, but it also has not produced the kind of strong upward thrust that usually appears when buyers are in firm control. As shown in the chart, the oscillator pair is aligned with the idea of a market that is improving, but not yet proving itself.
The more constructive clue comes from MACD at -0.009 versus signal at -0.016, with a positive histogram of 0.007. That setup means the faster line has moved above the signal line, even though both remain slightly below zero. In practical terms, downside momentum is fading, and the stock is building a mild positive bias, but it has not fully crossed into a strong bullish phase.
Volatility & Volume
Volatility is contained. The Bollinger Bands show an upper band at SGD 4.60, a middle band at SGD 4.42, and a lower band at SGD 4.23, while %B at 59% places the price slightly above the middle of the envelope. That generally signals a market with room to move either way, rather than one that is already extended. The 8.2% band width is normal, not squeezed and not expanded, which means the stock is not in the kind of compressed setup that often precedes a sharp move.
The ATR(14) of 0.10, equal to 2.2% of price, confirms moderate volatility. That is a useful signal because it suggests daily swings are present but not extreme, so a break of nearby levels could matter without requiring a dramatic market shock.
Volume is the main caution flag. Last turnover of 19,355,700 shares was only 0.6× the 20-hour average of 33,018,203, which means participation was relatively light. A price rise on thin volume often lacks conviction, and that is reinforced by the declining OBV, or on-balance volume, which tracks whether trading flow is accumulating or distributing. In this case, the price has improved, but the broader volume signal says investors have not yet committed strongly enough to confirm a sustained breakout.
Key Levels & Scenarios
The chart points to a market that is trapped between nearby boundaries. SGD 4.42 is the first reference point because it is the Bollinger middle band and the SMA20, so it represents the area where trend neutrality is being tested. Below that, SGD 4.25 is the key support level, and a failure there would suggest the recent recovery has lost traction. On the upside, SGD 4.60 to SGD 4.61 is the immediate resistance zone, where the upper Bollinger Band and 20-hour resistance converge.
If price can clear SGD 4.61 with stronger volume, the market would be signalling that the current sideways structure is giving way to a more constructive advance. If it slips back under SGD 4.25, the chart would argue that the rebound has failed and the stock is likely returning toward the lower part of its recent range. The SGD 4.15 three-month low sits as the deeper reference point beneath that support.
Technical Verdict: HOLD (wait & see)
HOLD (wait & see) fits best because the chart is improving, but not yet convincing enough to call a breakout.
- MACD histogram is positive, showing momentum has turned slightly more constructive.
- Price is above SMA20 and SMA50, which is supportive, but the SMA20 slope remains slightly negative and the stock is still in a sideways trend.
- Volume is only 0.6× average and OBV is falling, so the move lacks participation.
Verdict invalidated if price falls below SGD 4.25.
- Ideal Entry Range: SGD 4.42 to SGD 4.45
- Exit Target: SGD 4.60 to SGD 4.61
- Stop Loss protection: below SGD 4.25
In plain English: Singtel is holding up, but the market still wants proof before treating the recent bounce as something stronger.
Source: SGX via Yahoo Finance, as of 19 August 2026 08:00 WIB.
Summary Data Singtel
| Last price | 4.45 SGD |
| Change 1 day / 5 days / 1 month | 0.23% / 3.73% / 0.68% |
| Trend / MA-cross | sideways / none |
| SMA20 / SMA50 | 4.42 / 4.40 |
| RSI (14) / Stochastic %K | 51.0 / 47.1 |
| Bollinger %B / ATR | 59% / 0.10 |
| Support / Resistance 20 days | 4.25 / 4.61 |
| Data as of | 19 Agustus 2026 08:00 WIB |
Track Singtel share price daily: live levels, support/resistance and our full Singtel analysis history.


