T Stock Analysis: Gains 0.12%, Testing Key Resistance
On Agustus 21, 2026: price 25.15 USD, trend uptrend, RSI 66.1, support 23.06, resistance 25.15. technical analysis of t stock. Stock Analysis — full details…
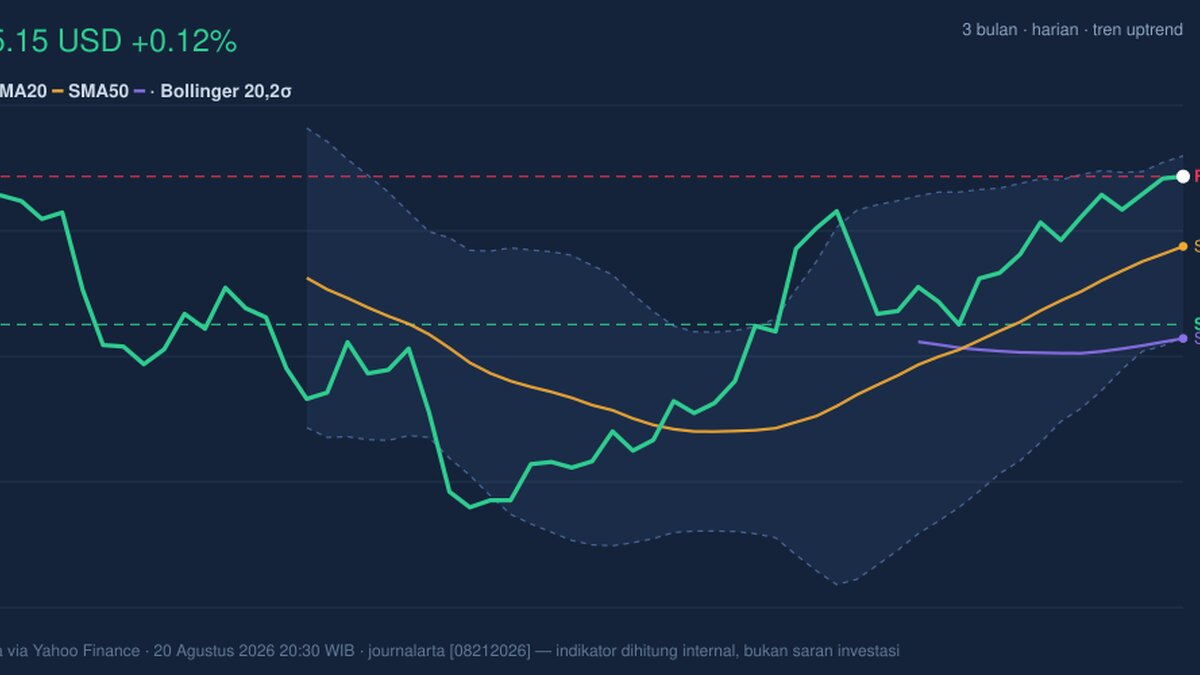
AT&T finished at 25.15 USD, up 0.12% on the day and 9.54% over one month, a move that keeps the stock pressed near the top of its recent range, as shown by the latest NYSE-linked data from Yahoo Finance. The number that matters most here is not just the gain. It is where the price sits: just under the upper Bollinger band and at the ceiling of the 20-hour range, which tells traders the rally is still intact but no longer cheap in technical terms.
Trend & Price Action
The broader pattern remains constructive. AT&T is trading above both its SMA20 at 24.16 and SMA50 at 22.86, which means the short-term trend is aligned with the medium-term trend rather than fighting it. That alignment matters because it signals persistent demand: buyers have been willing to step in at progressively higher levels instead of waiting for deeper pullbacks.
The SMA20 slope of 2.70% over 5 days reinforces that message. A rising moving average is not just a line moving up; it shows the average price itself is being dragged higher by recent trading, a sign that momentum has been broad enough to lift the trend rather than just produce a one-day spike.
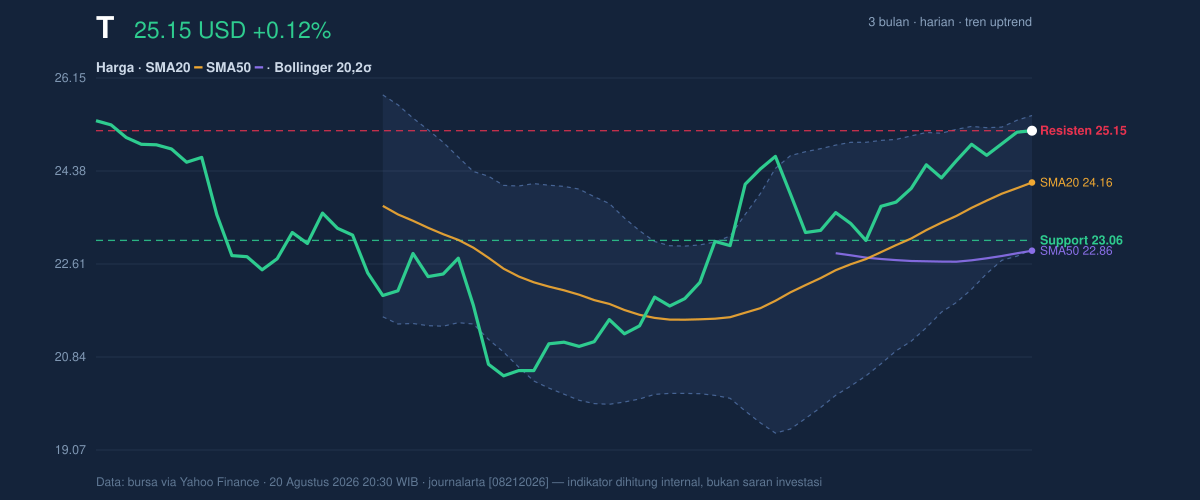
The price is also sitting near the top of its 3-month range, with the latest print at 25.15 versus a 3-month high of 25.48 and low of 19.89. That proximity to the high suggests the market is testing whether the recent advance can extend further, but it also means upside progress is now happening close to an area where some holders may begin taking profits.
Oscillators & Momentum
Momentum is supportive, but it is no longer fresh. The RSI at 66.1 is described as neutral, yet it is leaning toward the upper end of that band. In plain language, the stock is not overbought by a strict RSI reading, but it is approaching the zone where strength can start to look stretched if price keeps climbing without a pause.
The more telling signal comes from the Stochastic oscillator at %K 88.7 and %D 88.0, which is explicitly overbought. Stochastic is more sensitive than RSI, so when it is this high, it usually means the stock has been closing near the top of its recent trading range for several sessions. That does not automatically mean a drop is coming, but it does mean the near-term rally may be vulnerable to consolidation if fresh buyers do not keep arriving.
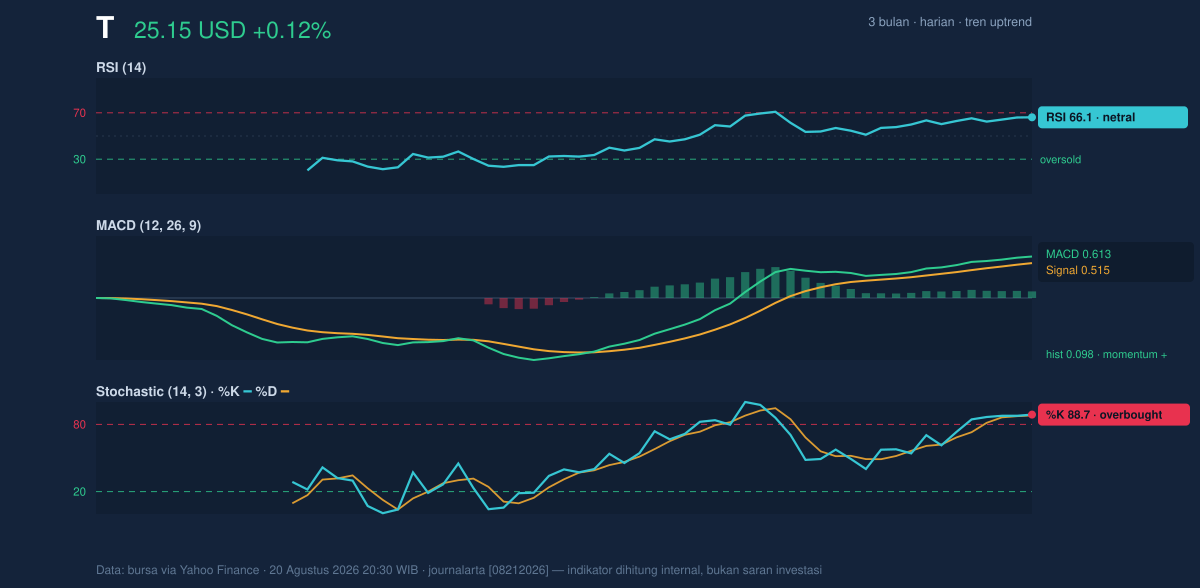
The MACD at 0.613, above its signal line at 0.515 with a 0.098 histogram, keeps the bullish case alive. MACD turns positive when shorter-term price strength overtakes longer-term momentum, so this reading says the trend is still supported from underneath. The key nuance is that MACD is positive while Stochastic is overbought: that combination often describes a trend that is still healthy, but temporarily extended.
Volatility & Volume
Volatility is manageable rather than explosive. The ATR of 0.52, equal to 2.1% of price, points to moderate daily movement. That suggests AT&T is not in a panic phase or a breakout frenzy; instead, it is moving with enough room for day-to-day swings, but not enough to imply disorderly trading.
Bollinger Bands add an important layer. With the upper band at 25.44, the middle band at 24.16, and the lower band at 22.89, price is trading near the top of the envelope, while %B at 89% shows it is close to the upper boundary. That reading means the stock is trading in the upper part of its recent volatility range, which often happens when a trend is strong. But it also means the market is closer to the point where momentum can cool if price fails to extend beyond the band.
The Bollinger width of 10.6% is normal, not compressed. So this is not a squeeze waiting to explode; it is a functioning trend environment where the question is whether the stock can keep holding the upper half of the range. Volume tempers the enthusiasm. The latest 25,229,200 shares were only 0.5× the 20-hour average of 47,789,655, which means the advance is happening on relatively quiet participation. That can be fine in a steady uptrend, but it also tells us the latest move did not arrive with a broad surge of conviction. Still, OBV is rising, and that matters because on-balance volume tracks whether volume is, on net, favoring accumulation. Rising OBV says money flow has been leaning positive even if the latest session itself was not heavy.
Key Levels & Scenarios
The immediate line in the sand is the 20-hour support at 23.06. If price loses that area, the current structure begins to weaken because it would mean the market has given back the recent range that supported the rally. On the upside, the first technical hurdle is the resistance at 25.15, which is effectively the latest closing level, and then the upper Bollinger band at 25.44. A move through that zone would show the stock is no longer just riding the top of its range but expanding beyond it.
Because price is already near the top of the band and the 20-hour range, the risk/reward profile is less about chasing momentum and more about whether the stock can digest gains without slipping back toward the middle band at 24.16. If it does, that would look like healthy consolidation. If it cannot, the market may be signaling exhaustion rather than continuation.
Technical Verdict: HOLD (wait & see)
HOLD (wait & see)
- MACD remains positive, which supports the underlying uptrend.
- Price is above SMA20 and SMA50, confirming trend alignment.
- Stochastic is overbought and %B is 89%, so the stock is extended near the top of its range.
- Verdict invalidated if price falls below 23.06, because that would break the nearest support and weaken the current structure.
- Ideal Entry Range: 24.16 to 24.16, near the Bollinger middle band and SMA20 where pullbacks have technical support.
- Exit Target: 25.44, the upper Bollinger band and nearest upside reference.
- Stop Loss protection: 23.06, below 20-hour support.
In plain English: AT&T still looks technically firm, but the stock is stretched enough that the next move matters more than the last one.
Summary Data T
| Last price | 25.15 USD |
| Change 1 day / 5 days / 1 month | 0.12% / 2.32% / 9.54% |
| Trend / MA-cross | uptrend / none |
| SMA20 / SMA50 | 24.16 / 22.86 |
| RSI (14) / Stochastic %K | 66.1 / 88.7 |
| Bollinger %B / ATR | 89% / 0.52 |
| Support / Resistance 20 days | 23.06 / 25.15 |
| Data as of | 20 Agustus 2026 20:30 WIB |
Track T stock price daily: live levels, support/resistance and our full T analysis history.