UOB Stock Drops 1.61%, Testing Support Level In Focus
On Agustus 21, 2026: price 40.22 SGD, trend sideways, RSI 34.4, support 40.56, resistance 43.89. technical analysis of uob stock. UOB Stock Drops — full…

United Overseas Bank’s SGX-listed shares fell to SGD 40.22 on 19 August 2026, down 1.61% from the previous close, as the stock continued to drift below its short- and medium-term averages on steady volume. The move matters because it shows more than a one-day dip: UOB is now trading under both the SMA20 at 42.68 and the SMA50 at 41.62, a sign that recent price action remains weak even though the broader pattern is still described as sideways.
Trend & Price Action
The chart shows a stock that has lost upward traction rather than entered a clean downtrend. UOB’s sideways trend classification, combined with the SMA20 slope of -1.18% over 5 days, suggests the market has been leaning lower inside a range instead of breaking into a decisive new leg. That distinction matters: sideways markets often punish momentum traders because rallies fade quickly, but they also avoid the one-way selling that defines a clear bear trend.
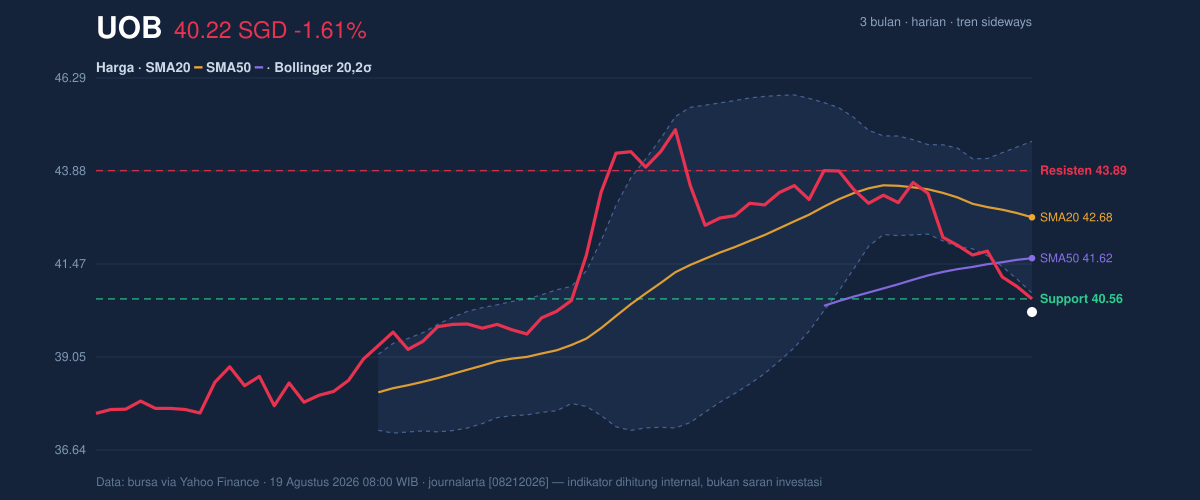
The latest close sits near the lower edge of the current Bollinger structure, with the lower band at 40.71 and price at 40.22. In plain terms, the stock is trading below the statistical range that has contained most recent moves, which usually signals pressure rather than strength. The %B of -12% reinforces that message: price is not just near the lower band, it is below it, which often happens when selling extends a little too far before buyers attempt a response.
The relative position inside the short-term range is also weak. UOB is at the lower end of the 40.56 to 43.89 support-resistance band, sitting about -10% from the top of that range. That tells readers the stock is not consolidating near resistance; it is hugging the lower boundary, where sentiment tends to be cautious and where any bounce needs proof.
Oscillators & Momentum
Momentum is mixed, but not in a reassuring way. The RSI at 34.4 is technically still neutral, yet it is close enough to oversold territory to show that downside pressure has already done meaningful damage. RSI does not say “rebound now”; it says the stock is approaching a zone where selling can become less efficient if fresh negative catalysts do not appear.
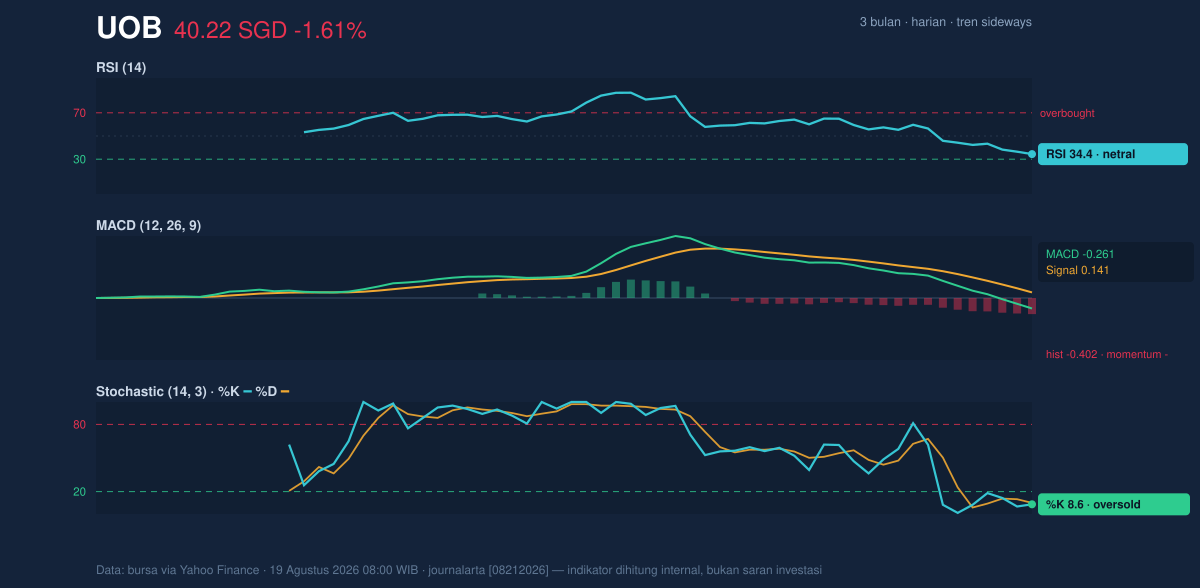
The more aggressive short-term oscillator, however, is already flashing fatigue. The Stochastic %K at 8.6 and %D at 9.9 are both oversold, meaning the latest closes are near the low end of the recent range. That often indicates a stock has been pushed down quickly relative to its own recent history, but it does not guarantee a turn. In weak markets, oversold readings can stay pinned for longer than traders expect.
The clearest momentum signal is the MACD at -0.261, below the signal line at 0.141, with a histogram of -0.402. That combination shows downside momentum is still dominant and not yet stabilizing. For general readers, MACD below signal means the shorter-term trend is underperforming the longer-term trend; a negative histogram means that gap is widening rather than closing. In other words, the market has not yet produced the kind of momentum shift that usually precedes a durable rebound.
Volatility & Volume
Volatility is present, but not extreme. The ATR(14) of 0.75, equal to 1.9% of price, points to a stock that can still move decisively in a session, but not in a disorderly fashion. The Bollinger band width of 9.2% is described as normal, which suggests this is not a squeeze waiting for a dramatic breakout. Instead, the stock appears to be moving within a fairly standard volatility envelope, with the current weakness coming from direction rather than from an unusual expansion in range.
Volume does not yet confirm a capitulation or a reversal. The latest turnover of 3,717,000 is almost exactly in line with the 20-day average of 3,676,613, or 1.0× normal. That means the sell-off is not being driven by a sudden surge of panic trading, but neither is there evidence of strong bargain-hunting. The OBV is declining, which is important because on-balance volume tracks whether trading flow is accumulating or distributing shares; here it suggests more shares are being sold into weakness than bought on dips.
Key Levels & Scenarios
The immediate map is straightforward. Support at 40.56 is already under pressure because price has slipped below it, while resistance at 43.89 remains well overhead and would need a meaningful recovery to come back into play. The lower Bollinger band at 40.71 sits just above the last price, so the market is effectively testing the lower end of the recent technical envelope.
The 3-month range adds context: 45.15 on the high side and 37.45 on the low side. UOB is closer to the lower half of that range than the upper half, which is consistent with a stock that has already given back a good portion of its recent gains but has not yet broken into a new low. If price can reclaim the 40.56 area and then move back through the 41.62 SMA50, it would signal that sellers are losing control. If it fails to hold the lower area and slips further, the chart would start to resemble a deeper range breakdown rather than a routine pullback.
Technical Verdict: HOLD (wait & see)
HOLD (wait & see)
- MACD remains negative and the histogram is -0.402, so downside momentum is still active.
- Stochastic is oversold at 8.6 / 9.9, which raises rebound potential but does not confirm it.
- Price is below the SMA20 and SMA50, keeping the burden on buyers to prove a turn.
Verdict invalidated if price falls below 40.56 and fails to recover, which would weaken the nearest support zone and increase the risk of a deeper slide.
- Ideal Entry Range: 40.56 to 41.62
- Exit Target (Target Price): 42.68 to 43.89
- Stop Loss protection: below 40.56
In plain English: the chart is weak, but it is also close enough to support that it needs one more session or two to show whether sellers still control the tape.
Summary Data UOB
| Last price | 40.22 SGD |
| Change 1 day / 5 days / 1 month | -1.61% / -4.12% / -5.85% |
| Trend / MA-cross | sideways / none |
| SMA20 / SMA50 | 42.68 / 41.62 |
| RSI (14) / Stochastic %K | 34.4 / 8.6 |
| Bollinger %B / ATR | -12% / 0.75 |
| Support / Resistance 20 days | 40.56 / 43.89 |
| Data as of | 19 Agustus 2026 08:00 WIB |
Track UOB share price daily: live levels, support/resistance and our full UOB analysis history.


