Alibaba Momentum Weakens: Stock Drops 2.54% (Agustus 24, 2026)
On Agustus 24, 2026: price 123.00 HKD, trend uptrend, RSI 54.5, support 111.00, resistance 128.10. technical analysis of alibaba stock.
Alibaba Group’s Hong Kong-listed shares fell to 123.00 HKD on 21 August, slipping 2.54% from the previous close of 126.20 HKD even as the broader setup still points to an uptrend on the chart, according to exchange-linked data via Yahoo Finance. The key message is not the one-day drop itself, but what it does to positioning: the stock is still trading above its 20-day moving average at 121.63 HKD and well above the 50-day average at 111.85 HKD, which keeps the medium-term structure intact. Yet the move also shows that momentum has cooled: the price is sitting in the upper part of its recent range, but it is no longer pressing cleanly toward the top band. That combination usually means the market is pausing, not breaking out.
Trend & Price Action
As shown in the chart, Alibaba’s price remains above both the SMA20 at 121.63 HKD and the SMA50 at 111.85 HKD, which is the classic sign that the prevailing trend has not been damaged. The SMA20 slope of 2.10% over 5 days suggests the short-term trend is still rising, but the absence of a fresh MA-cross means the chart is not flashing a new acceleration signal. In plain language, the stock is still riding an upward structure, but it is doing so without a new burst of trend confirmation.
That matters because the current price is also close enough to recent resistance to make follow-through harder. The stock is at 70% of its 20-hour range, with 111.00 HKD marked as support and 128.10 HKD as resistance. So the market is not in a deep pullback; it is sitting near the upper half of the corridor, where traders often watch for either a continuation attempt or a fade if buyers cannot extend the move.
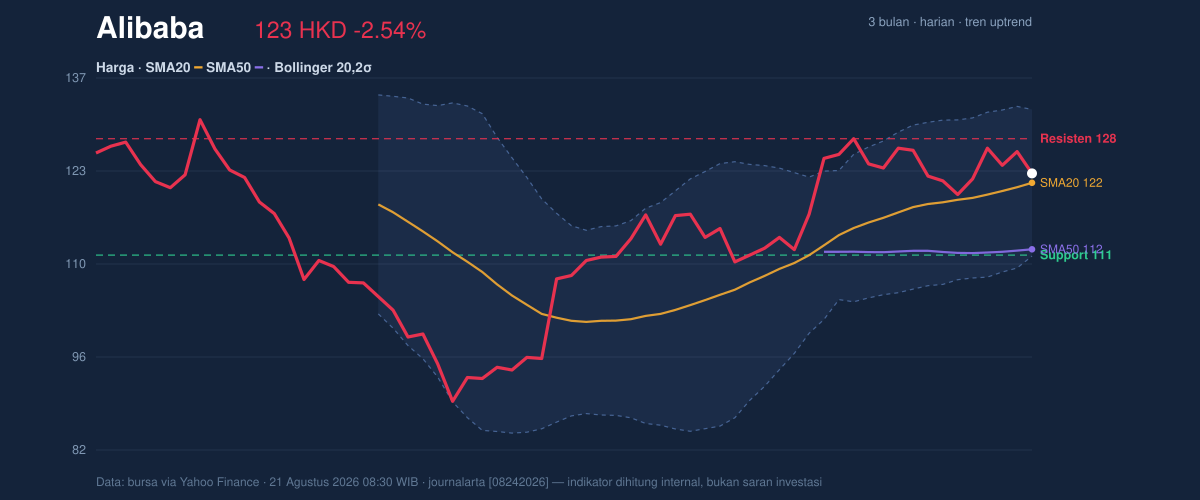
The chart suggests a market that is still constructive, but not yet decisive.
Oscillators & Momentum
The momentum panel is more mixed than the trend panel, which is where the nuance sits. RSI at 54.5 is neutral, meaning Alibaba is neither overbought nor oversold. That is important because it tells readers the stock is not stretched enough to force an immediate reversal, but it also is not weak enough to signal capitulation. The Stochastic %K at 38.1 and %D at 55.8 is also neutral, but with %K below %D, short-term momentum is softer than the broader trend would suggest.
The clearest caution comes from MACD. The MACD at 3.110 remains above zero, which keeps the longer trend constructive, but it is below the signal line at 3.415 and the histogram at -0.306 shows momentum is currently negative. In practical terms, that means the stock is still trending higher on a bigger timeframe, but the recent push has lost force. This is often what a market looks like before it either consolidates or retests support.
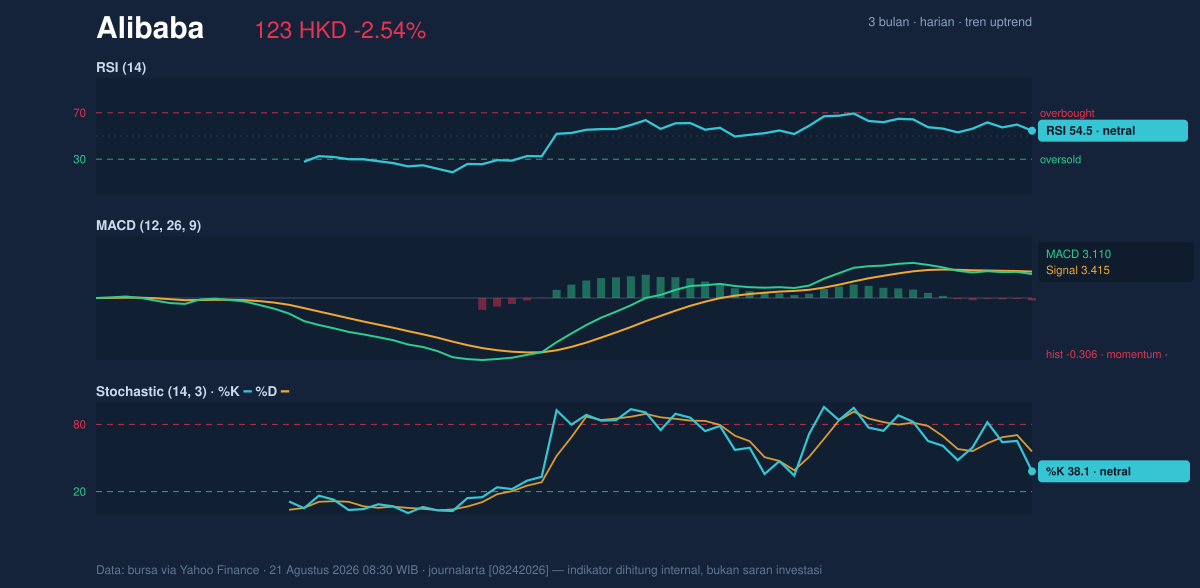
So the trend is up, but the momentum is no longer leading.
Volatility & Volume
Volatility is not low here. The ATR(14) of 4.54 HKD, equal to 3.7% of price, says daily swings remain relatively wide. That matters because it raises the odds of sharper intraday moves around support and resistance rather than a slow grind. At the same time, Bollinger Bands show the stock is not at an extreme: %B at 56% places price slightly above the middle band, while the band width of 17.7% is described as normal. In other words, this is not a squeeze setup where volatility is compressed and about to explode; it is a normal-volatility trend environment.
Volume adds an extra layer. The latest turnover of 146,890,540 shares is about 1.7× the 20-session average of 88,481,995, which means the move is being actively traded rather than ignored. But the OBV is down, and that is the subtle warning sign. OBV, or on-balance volume, tracks whether volume is accumulating on up days or distributing on down days. A falling OBV while price is still above key averages suggests participation has not fully confirmed the price structure. That does not break the trend, but it does reduce confidence in the latest bounce.
The volume is strong, but the volume trend is not fully supportive.
Key Levels & Scenarios
The most important levels are clear on the chart. Immediate support sits at 121.63 HKD from the SMA20, with deeper support at 111.00 HKD and then the Bollinger lower band at 110.85 HKD. On the upside, the first obstacle is 128.10 HKD, followed by the Bollinger upper band at 132.40 HKD and the 3-month high at 132.60 HKD. Since the stock is already above the middle band and inside the upper half of its range, the next move will likely be decided by whether buyers can reclaim the resistance zone near 128.10 HKD.
If price holds above 121.63 HKD, the chart keeps a constructive bias and leaves room for another test of 128.10 HKD. If it fails there while MACD remains below signal, the market may drift back toward 111.00 HKD. The current structure is therefore a trend that is intact, but one that needs renewed momentum to extend.
Technical Verdict: HOLD (wait & see)
HOLD (wait & see) fits best because the trend is still positive, but momentum and volume confirmation are incomplete.
- SMA20 and SMA50 remain aligned in an upward structure, with price above both averages.
- MACD is negative versus its signal line, showing the latest push has lost momentum.
- OBV is down, so volume participation is not fully confirming the price move.
- Verdict invalidated if price falls below 111.00 HKD, which would expose the lower Bollinger band at 110.85 HKD.
- Ideal Entry Range: 121.63 HKD to 123.00 HKD
- Exit Target: 128.10 HKD to 132.40 HKD
- Stop Loss protection: below 111.00 HKD
For non-traders, this means the stock is still structurally firm, but it needs stronger momentum before the chart looks fully convincing.
Alibaba’s 3-month high stands at 132.60 HKD.
Summary Data Alibaba
| Last price | 123.00 HKD |
| Change 1 day / 5 days / 1 month | -2.54% / 2.59% / 11.82% |
| Trend / MA-cross | uptrend / none |
| SMA20 / SMA50 | 121.63 / 111.85 |
| RSI (14) / Stochastic %K | 54.5 / 38.1 |
| Bollinger %B / ATR | 56% / 4.54 |
| Support / Resistance 20 days | 111.00 / 128.10 |
| Data as of | 21 Agustus 2026 08:30 WIB |
Track Alibaba share price daily: live levels, support/resistance and our full Alibaba analysis history.