CRM Stock Gains 1.82%, Testing Key Resistance In Focus
On Agustus 24, 2026: price 209.17 USD, trend uptrend, RSI 66.1, support 173.60, resistance 209.17. technical analysis of crm stock. CRM Stock Gains — full…
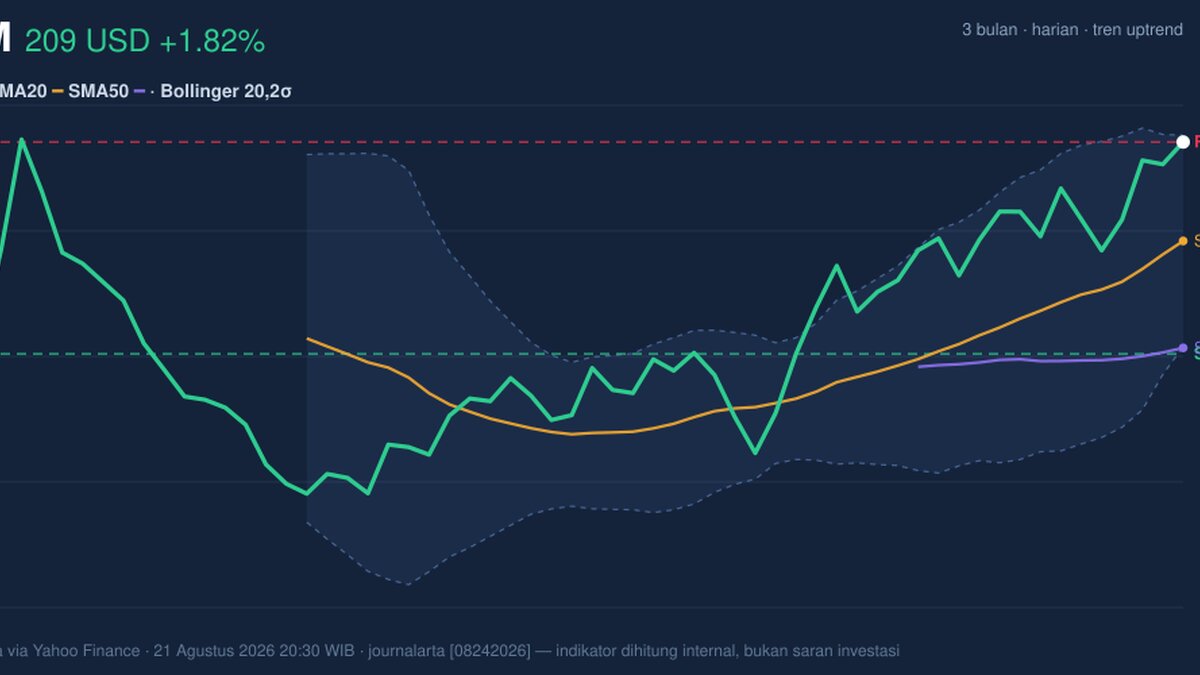
Salesforce Inc. rose to $209.17 on the NYSE on 21 August 2026, extending a run that has lifted the stock 1.82% in one day, 6.61% in five days and 27.81% over one month. The move matters because it puts CRM right at the top of its recent trading band, with the price now pressing against the upper edge of its Bollinger channel as momentum stays positive but increasingly stretched.
Trend & Price Action
The chart shows a stock that is still in a clear uptrend. CRM is trading above its 20-day moving average at $192.57 and well above its 50-day average at $174.60, which tells us the short-term trend is not just intact but running ahead of the longer one. That gap is important: when price sits comfortably above both averages, it usually signals that recent buying has been strong enough to keep pullbacks shallow.
There is no fresh moving-average crossover, so the story is not about a new technical trigger. Instead, it is about continuation. The 20-day average itself is rising at 4.91% over five days, which means the trend line underneath the price is still climbing rather than flattening out. In plain language, the market is not merely recovering; it is still being bid higher.
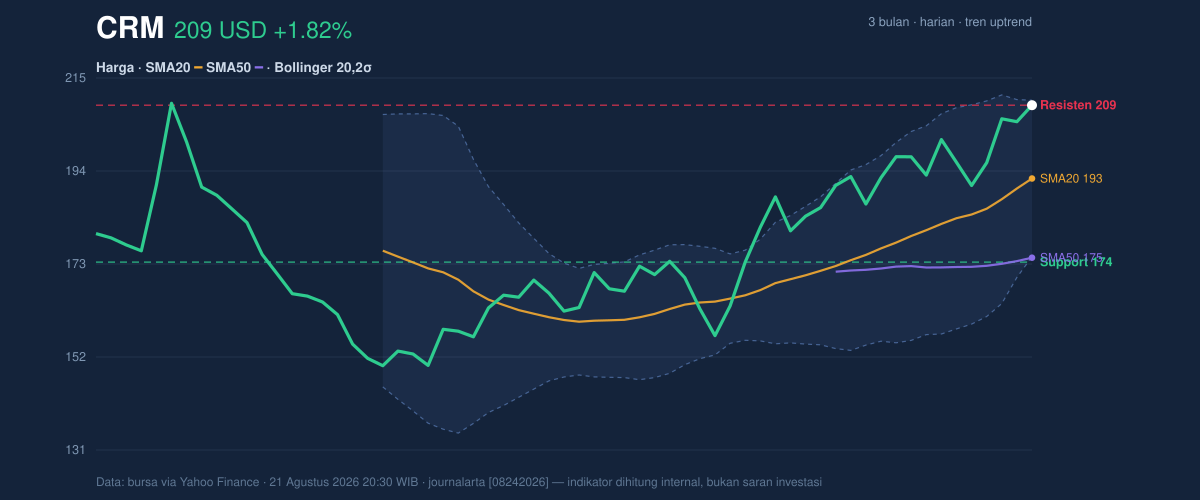
The stock is also sitting at the very top of its recent range. The 3-month high is $211.34, only a little above the current price, while the 3-month low is $146.32. That placement near the high suggests the market has already priced in a lot of the recent optimism. It does not mean the move is over, but it does mean there is less room for easy trend-following gains without a pause.
Oscillators & Momentum
Momentum remains constructive, but it is beginning to look crowded. RSI at 66.1 is neutral, which is a useful reminder that the stock is not yet in a classic overbought warning zone on that measure. At the same time, the Stochastic oscillator is flashing a hotter signal: %K at 93.2 and %D at 92.4 are overbought. That combination usually means the stock has climbed quickly enough that short-term traders may start looking for a breather, even if the broader trend is still up.
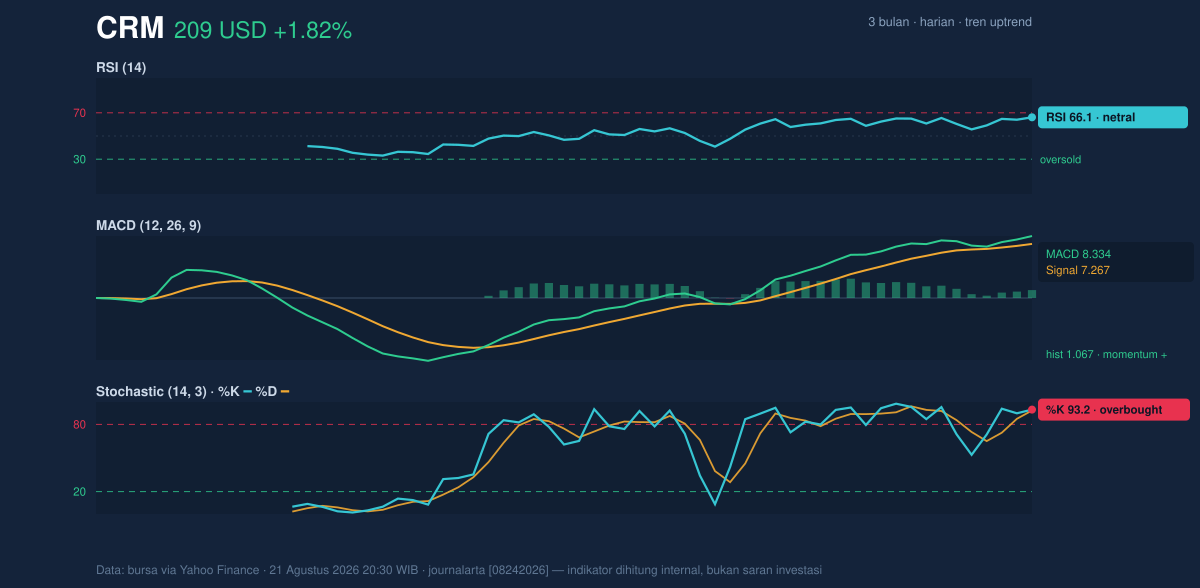
The MACD picture is still supportive. MACD at 8.334 sits above its signal line at 7.267, with a positive histogram of 1.067. For readers less familiar with the term, MACD compares short- and medium-term momentum; when it stays above the signal line, it suggests the recent pace of gains still exceeds the slower trend. In other words, the stock has not yet rolled over technically.
What matters now is the balance between these signals. RSI and MACD say the trend remains healthy, but Stochastic says the stock is stretched in the short run. That mix often appears near the later stages of a strong advance: the trend stays up, but the next move can become more volatile and less linear.
Volatility & Volume
Volatility is elevated enough to keep traders alert. ATR at 7.77, or 3.7% of price, points to high daily movement. ATR measures how much a stock typically moves in a day, so this reading implies CRM can still swing meaningfully even while the broader trend remains positive. That matters because a strong trend with high ATR can travel quickly, but it can also give back gains just as fast if momentum fades.
The Bollinger Bands add another layer to that picture. %B at 97% shows the stock is trading very close to the upper band at $210.30, with the middle band at $192.57 and the lower band at $174.83. The band width of 18.4% is described as normal, so this is not a volatility squeeze waiting to explode; instead, it is a steady expansion phase where price is already near the upper boundary. That often means the market is extended, not compressed.
Volume does not yet confirm an aggressive breakout. The latest volume was 9,612,800, below the 20-day average of 12,796,040, or about 0.8× normal. That is an important nuance: the stock has moved up without unusually heavy participation on the latest session. At the same time, OBV is rising, which suggests that over time more volume has been attached to up days than down days. Put simply, the broader volume trend still supports the advance, even if the latest session was not a surge.
Key Levels & Scenarios
The immediate technical map is tight. Resistance sits at $209.17, which is effectively the current price, while the upper Bollinger band at $210.30 and the 3-month high at $211.34 form the next ceiling. On the downside, support is $173.60, with the 50-day average at $174.60 and the lower Bollinger band at $174.83 clustering nearby. That cluster matters because it marks the area where trend support, medium-term average support and volatility support all converge.
If CRM can push cleanly through the $210.30-$211.34 zone, the chart would be showing a fresh high rather than just a test of resistance. If it fails there, the most likely technical response is a cooling-off move back toward the $192.57 middle band and 20-day average. The key point is that the stock is not in a weak structure; it is in a stretched one.
Technical Verdict: HOLD (wait & see)
HOLD (wait & see)
- MACD remains positive, so the trend still has momentum behind it.
- Price is above the 20-day and 50-day averages, confirming the broader uptrend.
- Stochastic is overbought and %B is 97%, which suggests the stock is extended near resistance.
Verdict invalidated if price falls below $173.60.
- Ideal Entry Range: $192.57 to $174.83
- Exit Target: $210.30 to $211.34
- Stop Loss protection: below $173.60
In plain English: the trend is still up, but the stock looks close enough to resistance that patience matters more than chasing the move.
Salesforce’s latest close of $209.17 leaves it just beneath the $210.30 upper Bollinger band and $211.34 3-month high.
Summary Data CRM
| Last price | 209.17 USD |
| Change 1 day / 5 days / 1 month | 1.82% / 6.61% / 27.81% |
| Trend / MA-cross | uptrend / none |
| SMA20 / SMA50 | 192.57 / 174.60 |
| RSI (14) / Stochastic %K | 66.1 / 93.2 |
| Bollinger %B / ATR | 97% / 7.77 |
| Support / Resistance 20 days | 173.60 / 209.17 |
| Data as of | 21 Agustus 2026 20:30 WIB |
Track CRM stock price daily: live levels, support/resistance and our full CRM analysis history.