HSBC RSI Oversold: Stock Drops 4.87% (October 8, 2026)
On October 8, 2026: price 142.60 HKD, trend downtrend, RSI 26.1, support 142.60, resistance 164.90. technical analysis of hsbc stock. HSBC RSI Oversold — full…
Trend & Price Action
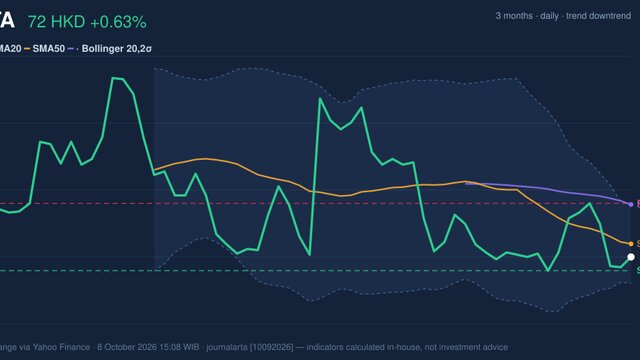
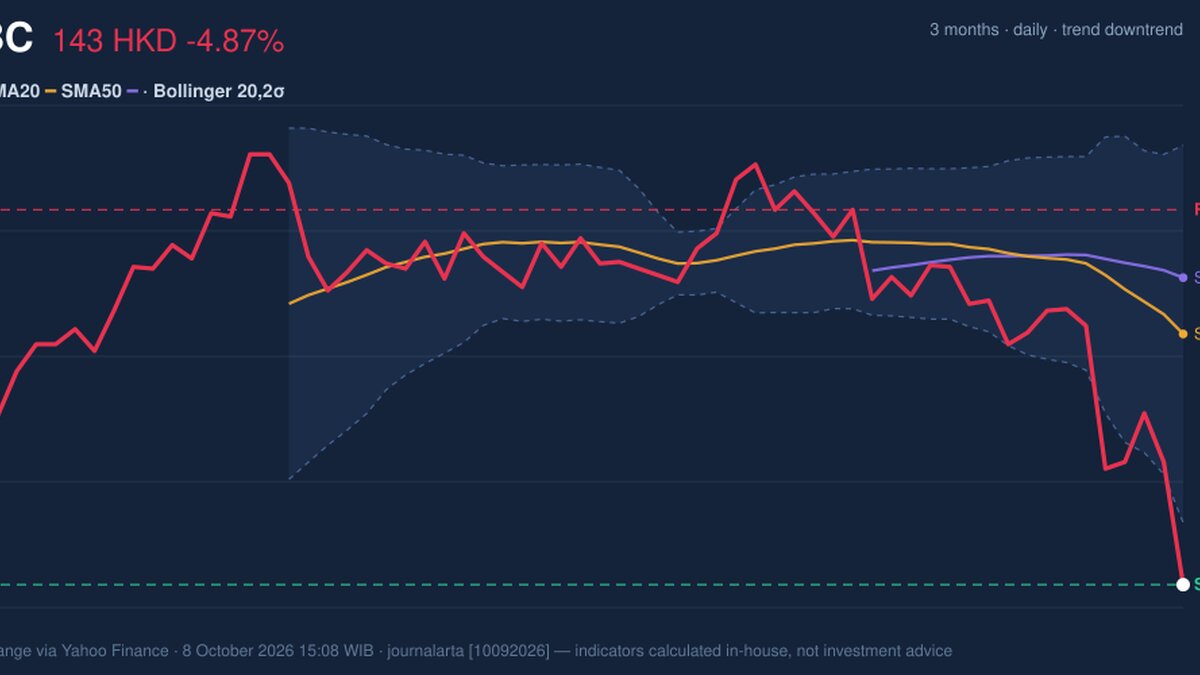
The decline extends a broader slide: HSBC is down 9.75% over five days and 14.10% over one month. At HK$142.60, the stock is below its SMA20 of HK$157.51 and SMA50 of HK$160.86. The 20-day average is falling, with its slope at -2.60% over five days, confirming that the trend is deteriorating rather than merely moving sideways. There has been no new moving-average crossover; the important signal is the price’s distance below both averages. The shares are trading beneath both trend measures, with the short-term average still falling. That makes the current low a test of support, not evidence on its own that the downtrend has ended. The lower Bollinger Band, a measure of unusually low prices relative to recent volatility, is HK$146.29. The last price is below that band, with %B at -16%. This indicates an unusually weak reading, but does not establish that the price must rebound. Band width is 14.3%, classified as normal, so the data do not show a volatility squeeze that might otherwise signal an impending sharp move.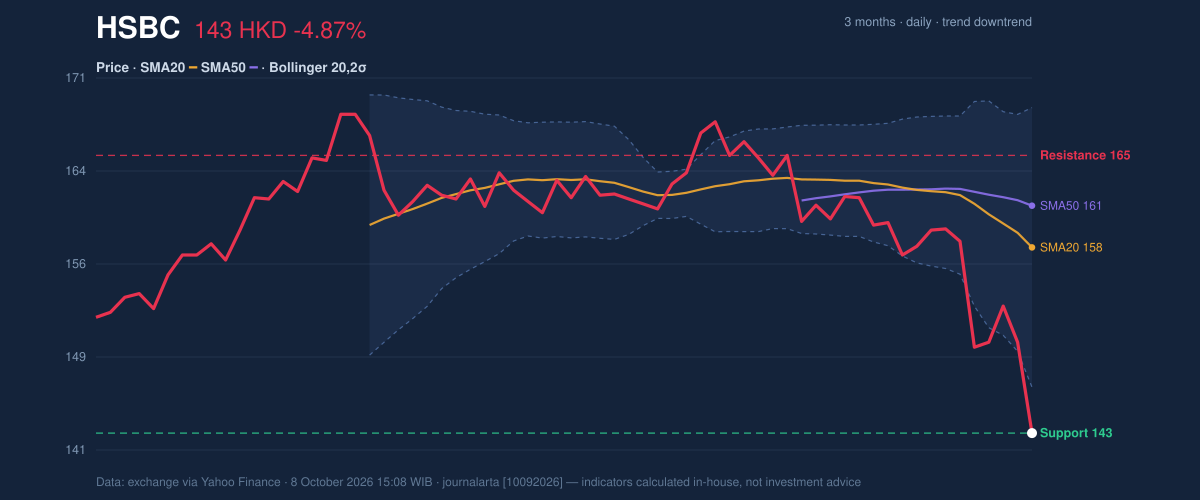
Oscillators & Momentum
RSI, a gauge of recent buying and selling pressure, is 26.1, in oversold territory. Stochastic readings are also stretched: %K is 2.7 and %D is 16.0. These levels say the decline has been intense and that selling may be vulnerable to a pause. They do not confirm a reversal, particularly while price remains below its moving averages. RSI and Stochastic are oversold, but MACD still points lower. MACD is -3.594 against a signal line of -2.072, while its histogram is -1.522. The negative readings show that downward momentum remains in place; there is no positive momentum signal here to offset the weak trend.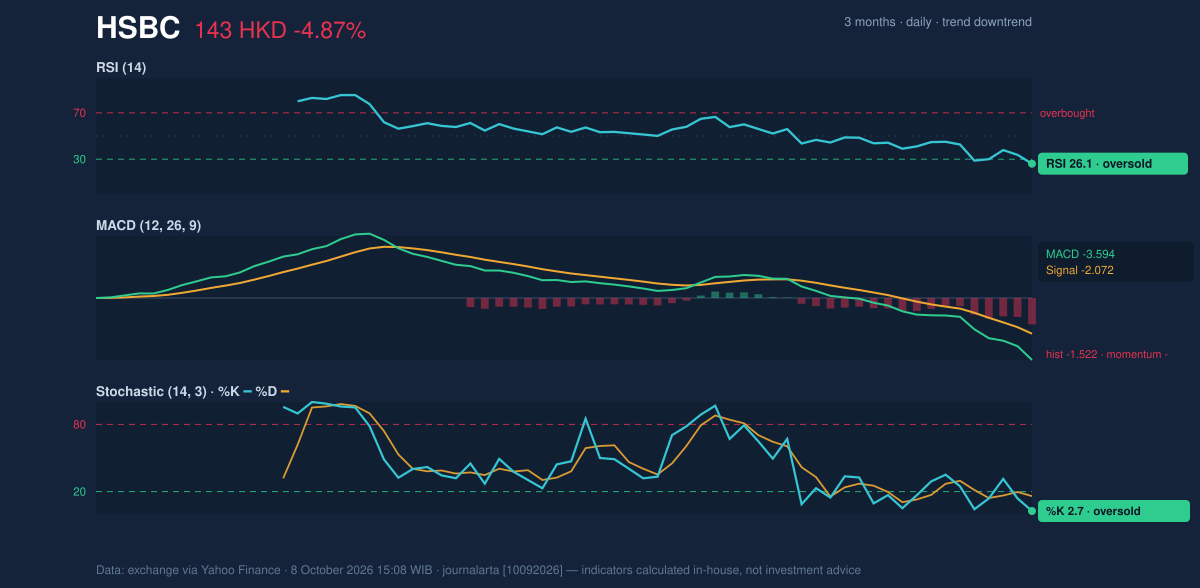
Volatility, Volume & Levels
Trading volume reached 32,302,444 shares, compared with a 20-day average of 11,105,340. Such a large jump alongside a 4.87% decline suggests the sell-off drew unusually broad participation, rather than occurring on thin turnover. On-balance volume (OBV), which tracks whether volume tends to accompany rising or falling prices, is also declining. Together, those signals reinforce the risk that sellers remain in control. The 14-day ATR is HK$3.60, or 2.5% of the share price, indicating moderate volatility. The day’s move was about 1.9 times that typical range, making the closing level especially significant: HK$142.60 is both the 20-day support reading and the bottom of the stated 20-day range. The three-month low is HK$142.00. HK$142.00–HK$142.60 is the immediate downside test. A break below HK$142.00 would put the shares beneath the stated three-month low and invalidate a stabilization case based on the current support zone. If that area holds, oversold oscillators leave room for a bounce, though resistance at HK$164.90 and the SMA20 at HK$157.51 mark hurdles, not confirmed recovery levels. The upper Bollinger Band is HK$168.73.Technical Verdict: HOLD (wait & see)
HOLD (wait & see) reflects a conflict in the signals, not a claim that the decline has reversed. The downtrend, negative MACD and falling OBV weigh against a bullish reading; oversold RSI and Stochastic readings, near-low support and a high-volume drop make the next move uncertain. The verdict is invalidated if the price falls below HK$142.00, the three-month low.- Illustrative entry range: HK$142.00–HK$146.29, spanning the three-month low and lower Bollinger Band.
- Reference exit target: HK$157.51–HK$164.90, from the SMA20 to 20-day resistance.
- Protective stop level: Below HK$142.00, the stated three-month low.
Market data: exchange data via Yahoo Finance, as of Oct. 8, 2026, 15:08 WIB.
Why HSBC is in focus today
- One-day move of -4.87%, about 1.9× its average daily range (ATR)
- Volume at 2.9× the 20-day average
- Closed at a 20-day low (142.60)
- Trading near its 3-month low (142.00)
- RSI(14) at 26.1 — oversold zone
- Downtrend extending (5-day change -9.75%)
Selected automatically from 16 HKEX (Hong Kong) stocks by a technical-signal score with daily weighted randomisation — not a recommendation.
Summary Data HSBC
| Last price | 142.60 HKD |
| Change 1 day / 5 days / 1 month | -4.87% / -9.75% / -14.10% |
| Trend / MA-cross | downtrend / none |
| SMA20 / SMA50 | 157.51 / 160.86 |
| RSI (14) / Stochastic %K | 26.1 / 2.7 |
| Bollinger %B / ATR | -16% / 3.60 |
| Support / Resistance 20 days | 142.60 / 164.90 |
| Data as of | 8 October 2026 15:08 WIB |
Disclaimer: This technical analysis is generated automatically from exchange data (via Yahoo Finance) and indicators calculated by JournalArta, for information and education only. The verdict and the entry, target and stop-loss levels are not investment advice or a solicitation to buy or sell any security. Investment decisions and their risks rest solely with the reader.
Track HSBC share price daily: live levels, support/resistance and our full HSBC analysis history.