ANTA Stock Technicals: Gains 0.63% on Thursday, Testing Support Level
On October 8, 2026: price 71.80 HKD, trend downtrend, RSI 43.6, support 71.20, resistance 74.15. technical analysis of anta stock. ANTA Stock Technicals — full…
Why ANTA is in focus today
- Downtrend extending (5-day change -2.64%)
- Not covered by JournalArta in the last 14 days
Selected automatically from 16 HKEX (Hong Kong) stocks by a technical-signal score with daily weighted randomisation — not a recommendation.
Trend & Price Action
The rebound has not yet changed the underlying price structure. ANTA trades below its 20-day simple moving average (SMA) of HK$72.38, which is itself falling, with its slope down 1.05% over five trading days. The price also sits below the 50-day SMA at HK$74.10. These averages track recent prices: when a share remains below them, rallies may face resistance from investors who bought at higher levels. There has been no new crossover between the moving averages to suggest a change in trend. ANTA is also near the lower end of its 20-trading-day range, at about 20% of the distance from support to resistance. Its three-month high and low are HK$80.90 and HK$70.30, respectively. The chart shows how the recent rebound sits against the downward-sloping averages and the nearby range boundaries.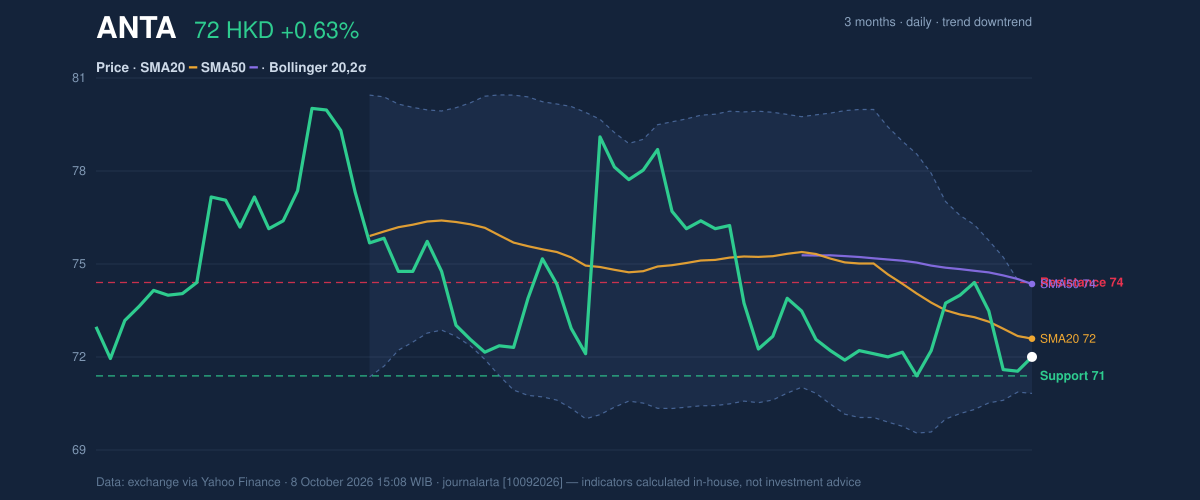
Oscillators & Momentum
Momentum readings are mixed rather than decisively bearish. The 14-day Relative Strength Index (RSI), which measures the pace of recent gains and losses, is 43.6—neutral territory, not an oversold reading. The Stochastic oscillator is also classified as neutral, with %K at 33.0 and %D at 26.7. These indicators do not yet show strong evidence that buyers have taken control. MACD offers a small counterpoint. Its reading is -0.579 against a signal line of -0.580, leaving a positive histogram of 0.001. The histogram compares MACD with its signal line; a positive value indicates a slight improvement in short-term momentum, but its narrow margin makes this a tentative signal, not confirmation of a reversal. The chart places the near-flat MACD reading alongside neutral RSI and Stochastic readings.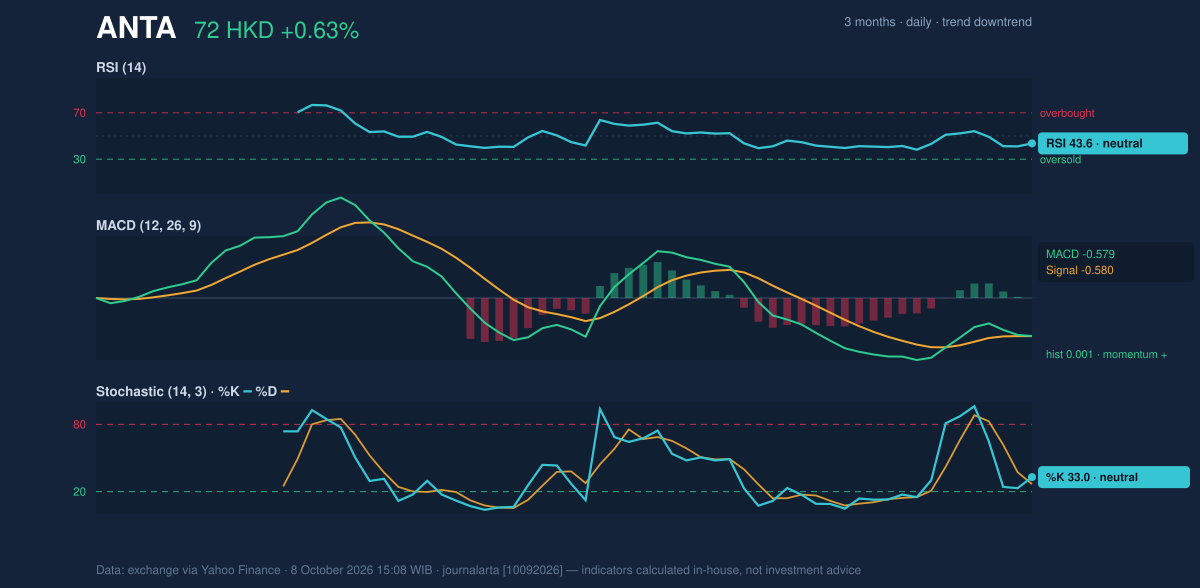
Volatility, Volume & Key Levels
The Bollinger Bands—bands that widen or narrow with recent price volatility—are tightening, with a 4.8% width. That squeeze can precede a larger move, but does not indicate which direction it will take. ANTA’s position at 33% of the band range, between HK$70.65 and HK$74.10, shows it remains in the lower half. The Average True Range (ATR), a measure of typical price movement, is HK$1.59, or 2.2% of the share price, consistent with moderate volatility. Trading volume was 5.92 million shares, about 0.9 times its 20-trading-day average of 6.46 million. That below-average activity tempers the significance of the daily rise. On the other hand, rising On-Balance Volume (OBV)—a cumulative measure that adds or subtracts volume according to price direction—suggests buying participation has improved, even as price remains weak. The immediate test is support at HK$71.20, with the three-month low of HK$70.30 a further reference point. A sustained move below those levels would deepen the breakdown. On the upside, resistance at HK$74.15 is close to the 50-day average; clearing it would help challenge the broader downtrend. The squeeze makes a break more consequential, but low volume and the falling 20-day average argue for caution until price confirms a direction.Technical Verdict: HOLD (wait & see)
The indicators support a neutral verdict: the price remains below falling short-term and 50-day averages, while the Bollinger squeeze signals that a sharper move may be approaching without specifying its direction. MACD momentum has edged positive, but neutral oscillators and below-average volume do not yet confirm a reversal. - Ideal Entry Range: HK$70.65–HK$71.20, around the lower Bollinger Band and 20-trading-day support. - Exit Target (Target Price): HK$74.10–HK$74.15, at the upper Bollinger Band and nearby resistance. - Stop Loss: Below HK$70.30, the three-month low. - Invalidation condition: The neutral verdict is invalidated if the price falls below HK$70.30. For non-traders, the signals are mixed: the share has bounced, but it has not yet demonstrated that its decline has ended.Data
Exchange data via Yahoo Finance, as of 8 October 2026, 15:08 WIB. Last price HK$71.80; previous close HK$71.35; daily change +0.63%; five-day change -2.64%; one-month change -2.31%. SMA20 HK$72.38; SMA50 HK$74.10; Bollinger upper/middle/lower HK$74.10/HK$72.38/HK$70.65; RSI 43.6; Stochastic %K/%D 33.0/26.7; MACD/signal/histogram -0.579/-0.580/0.001; ATR HK$1.59; volume 5,916,060; 20-day average volume 6,455,318; support/resistance HK$71.20/HK$74.15; three-month high/low HK$80.90/HK$70.30.Summary Data ANTA
| Last price | 71.80 HKD |
| Change 1 day / 5 days / 1 month | 0.63% / -2.64% / -2.31% |
| Trend / MA-cross | downtrend / none |
| SMA20 / SMA50 | 72.38 / 74.10 |
| RSI (14) / Stochastic %K | 43.6 / 33.0 |
| Bollinger %B / ATR | 33% / 1.59 |
| Support / Resistance 20 days | 71.20 / 74.15 |
| Data as of | 8 October 2026 15:08 WIB |
Disclaimer: This technical analysis is generated automatically from exchange data (via Yahoo Finance) and indicators calculated by JournalArta, for information and education only. The verdict and the entry, target and stop-loss levels are not investment advice or a solicitation to buy or sell any security. Investment decisions and their risks rest solely with the reader.
Track ANTA share price daily: live levels, support/resistance and our full ANTA analysis history.